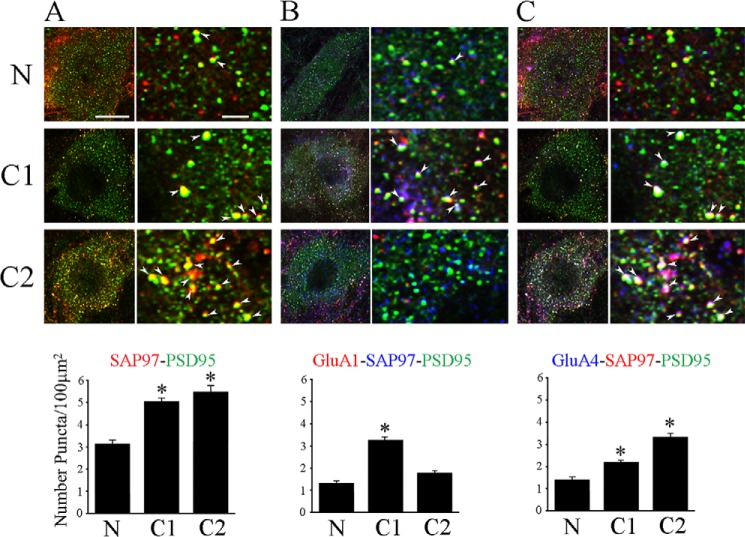
FIGURE 7.
Visualization of protein colocalization in abducens motor neurons by immunostaining and confocal microscopy. Images of labeled neurons are shown to the left of each panel and higher power magnification of punctate staining is shown at right for each experimental group. Quantitative analysis of punctate staining using stereological procedures is shown below. A, colocalization of SAP97 (red) and PSD95 (green) was significantly increased after conditioning for C1 and C2 compared with naïve preparations. Colocalization is shown as yellow staining and is indicated by the arrowheads. B, triple-label colocalization of GluA1 (red), SAP97 (blue), and PSD95 (green) increased greatly at C1 but then declined to naïve values at C2. The decline at C2 was due to loss of GluA1 punctate staining as there was ample colocalization of SAP97-PSD95 (see A), which appears as light blue staining in the lowest image panel in B for C2. C, triple-label colocalization of GluA4 (blue), SAP97 (red), and PSD95 (green) was also observed to increase at C1 but this staining was further increased at C2 and is shown as white staining. *, significant differences from N. Scale bars, 10 μm in panels to the left, 2 μm in panels to the right.

