FIGURE 3.
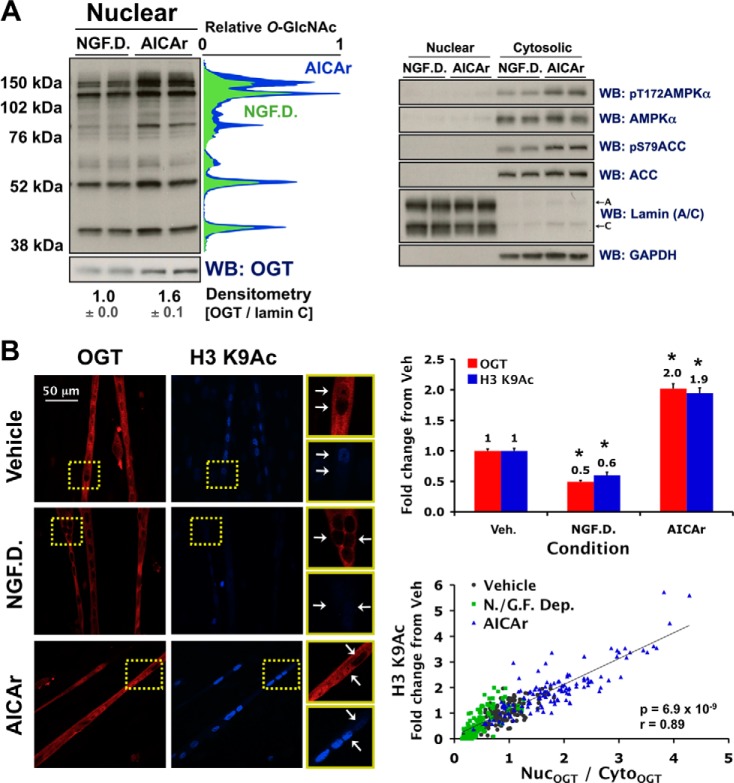
Nuclear localization of OGT correlates with O-GlcNAcylation of nuclear proteins and H3 Lys-9 acetylation in C2C12 myotubes. A, cytosolic and/or nuclear extracts from differentiated C2C12 cells subjected to 2 h of NGF.D. or 0.5 mm AICAr were immunoblotted (WB) for O-GlcNAcylated protein, OGT, and controls as indicated, including lamin (A/C) (nuclear loading control) and GAPDH (cytosolic loading control). Quantified densitometric lane profiles (relative scale of 0 to 1) of the representative O-GlcNAc WB were normalized to lamin C (NGF.D. (green), AICAr (blue)). B, confocal projections of fixed C2C12 myotubes incubated for 2 h in vehicle, NGF.D. buffer, or AICAr (0.5 mm), and stained for OGT (red) and H3 K9Ac (blue). Examples of correlation between OGT and H3 K9Ac nuclear staining for each condition are cropped (yellow boxes), blown up (right panels), and indicated with white arrows. Correlative and mean value (± S.E.) quantification of the nuclear-to-cytoplasmic ratios of OGT immunofluorescence (NucOGT/CytoOGT) and H3 K9Ac nuclear immunofluorescence (normalized to vehicle; Veh.) are plotted (>120 nuclei/condition). * denotes statistical significance of p < 1 × 10⁻²⁰ versus Veh.

