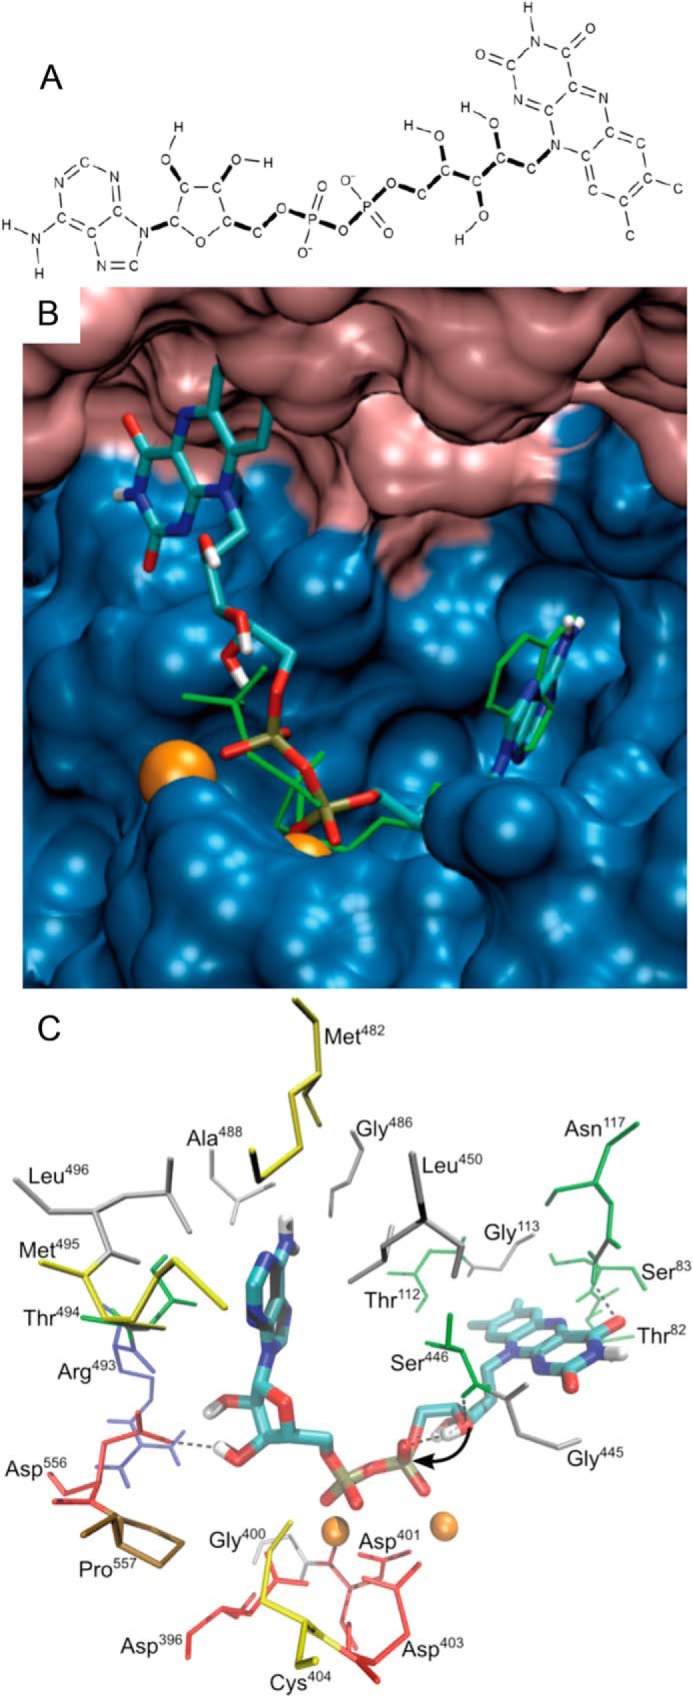
FIGURE 6.

FAD docked to the K2-L1 active site of hTKFC. Docking to the L2-K1 and K2-L1 sites was modeled with AutoDock with good results only in the second case (see further details in the main text). The file describing the full model is available as supplemental File 4 (hTKFC_FAD.pdb). A, FAD structure used for docking. Thick bonds correspond to active torsions; i.e. they were allowed to rotate during docking. Only polar hydrogens are shown. B, FAD docked to the K2-L1 site shown in overlap with (green rods) the ATP bound to the same site as it appears in the right-hand side of Fig. 5B. C, detail of amino acids near the bound 2Mg2+-FAD. The curved arrow indicates the internal attack by the ribityl 4′-oxygen atom over the proximal phosphorus atom in the FMN cyclase reaction.
