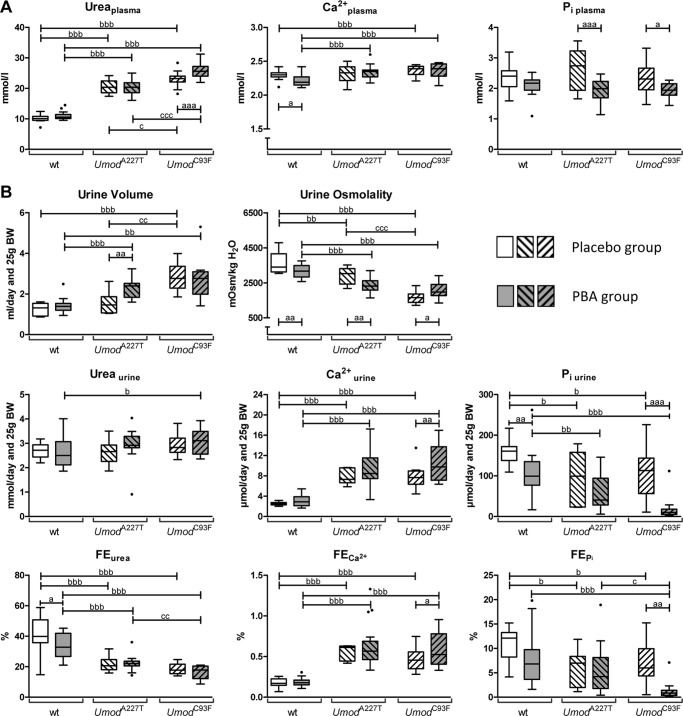
FIGURE 1.
Effect of placebo and 4-PBA treatment on plasma and urine parameters in wild-type and Umod mutant mice. A, clinical-chemical plasma parameters. B, urinary parameters of kidney function. Data are presented in Tukey's box plot (whiskers go 1.5 times the interquartile range or to the highest or lowest point, whichever is shorter), with outliers represented as dots. n = 6–19 per genotype and treatment group. 2-way ANOVA: a,b,c, p < 0.05; aa,bb,cc, p < 0.01; aaa,bbb,ccc, p < 0.001; a, 4-PBA versus placebo of the same genotype; b, homozygous mutant versus wild-type of the same treatment group; c, homozygous UmodC93F mutant versus homozygous UmodA227T mutant of the same treatment group.

