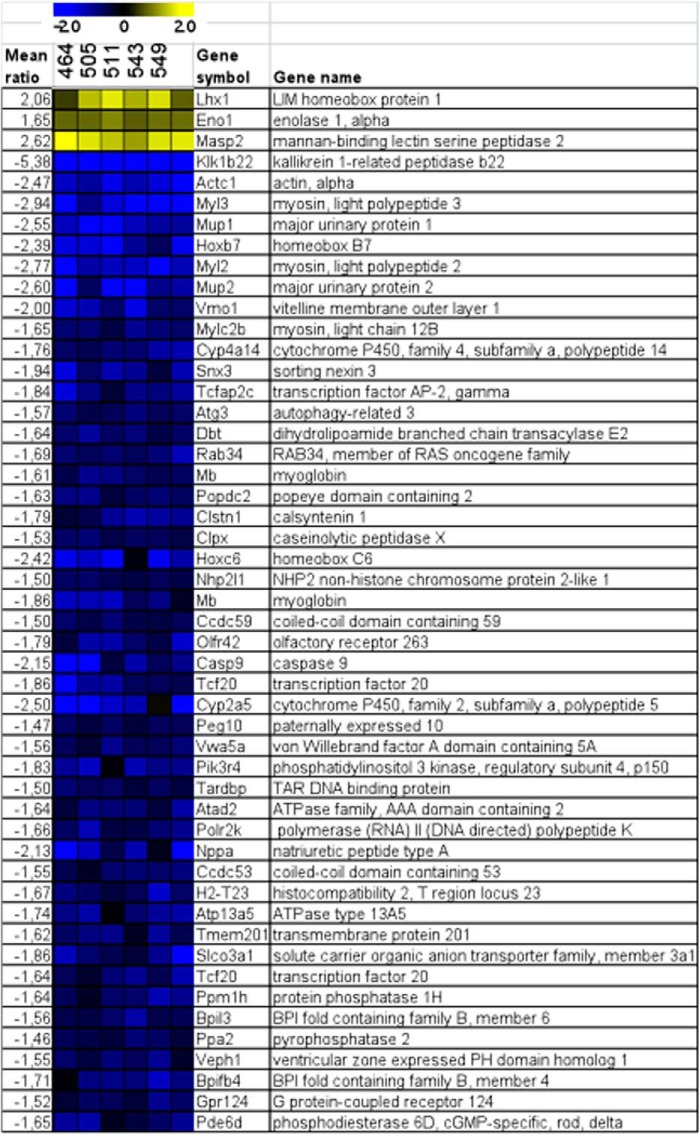
FIGURE 9.
Heat map of brain from gene expression profiling experiments, Tardbp mutants versus control animals. The expression differences are represented by the -fold changes of mutant/mean controls. Scale bar, ratio of the -fold induction. Blue/yellow, transcriptional repression/induction in the mutant mice. The color intensity reflects the magnitude of the change in gene expression levels on average.

