FIGURE 1.
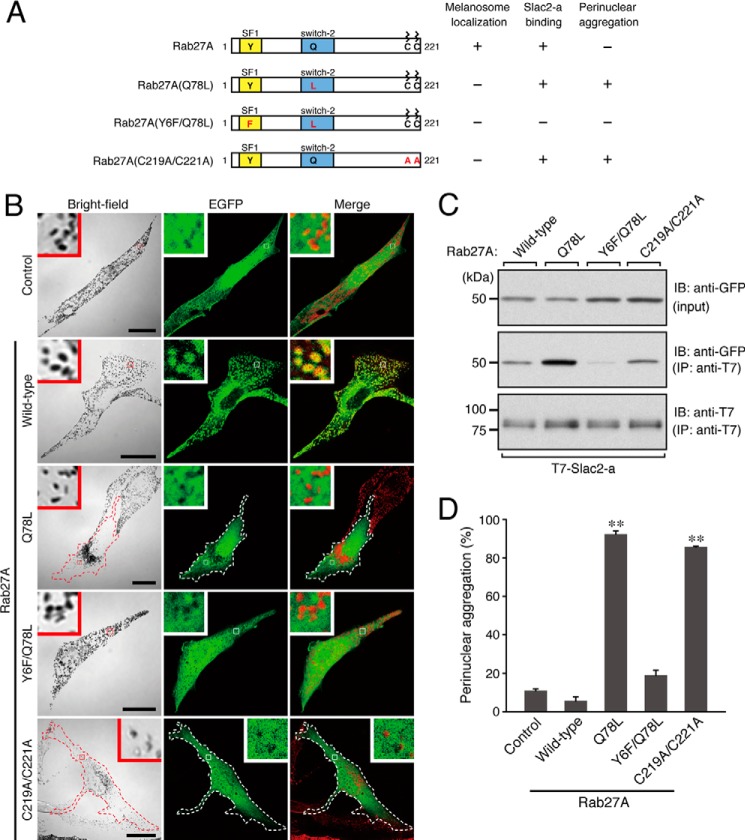
Effect of expression of Rab27A mutants on melanosome distribution in melanocytes. A, schematic of the Rab27A mutants used in this study. The melanosome localization activity, Slac2-a binding activity, and perinuclear aggregation activity of each mutant are shown in the right panel. The SF1 region is one of the conserved regions of a certain Rab subfamily (28), and the switch-2 region is thought to be sensitive to the nucleotide-binding state of Rab proteins. B, typical images of melanocytes expressing EGFP-tagged Rab27A mutants and EGFP alone (EGFP fluorescence images and their corresponding bright-field images). Cells exhibiting perinuclear melanosome aggregation are outlined with a dashed line. The melanosomes in the merged images (right column) are pseudocolored in red. The insets show magnified views of the boxed areas. Note that wild-type Rab27A alone, and not any of the Rab27A mutants, is present on mature melanosomes (second row, yellow signals in the inset). Scale bars = 20 μm. C, Slac2-a binding activity of the Rab27A mutants. Testing for associations between T7-tagged Slac2-a and EGFP-tagged Rab27A (wild-type and mutants) was performed by coimmunoprecipitation assays with anti-T7 tag antibody-conjugated agarose beads as described previously (23, 27). Coimmunoprecipitated EGFP-Rab27A (center panel) and immunoprecipitated T7-Slac2-a (IP) (bottom panel) were detected with the antibodies indicated. Input means 1/80 volume of the reaction mixture used for immunoprecipitation (top panel). The positions of the molecular mass markers (in kilodaltons) are shown at the left. IB, immunoblot. D, the number of melanocytes showing perinuclear melanosome aggregation is expressed as a percentage of the number of transfected melanocytes shown in B. **, p < 0.01, unpaired Student's t test.

