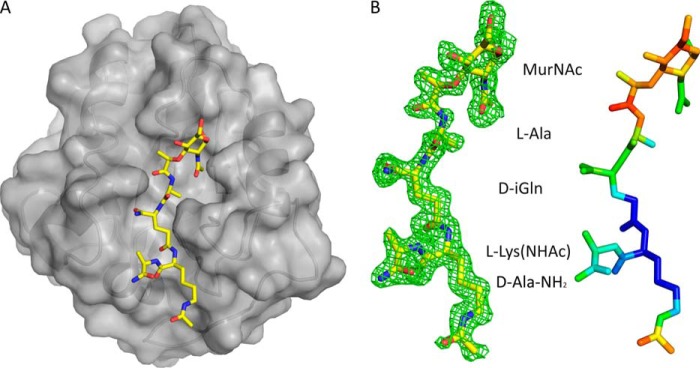
FIGURE 2.

AmiA-cat in complex with MtetP. A, AmiA-cat (semitransparent gray surface) bound MtetP (yellow sticks) in the active site. B, the close-up on MtetP surrounded by omit density illustrates that the ligand is well defined. Still, the B-factor distribution of MtetP displays the elevated flexibility of its MurNAc moiety. The difference omit map is shown at a σ level of 2.0, and the color scale for B-factors ranges from blue (20 Å2) to red (50 Å2).
