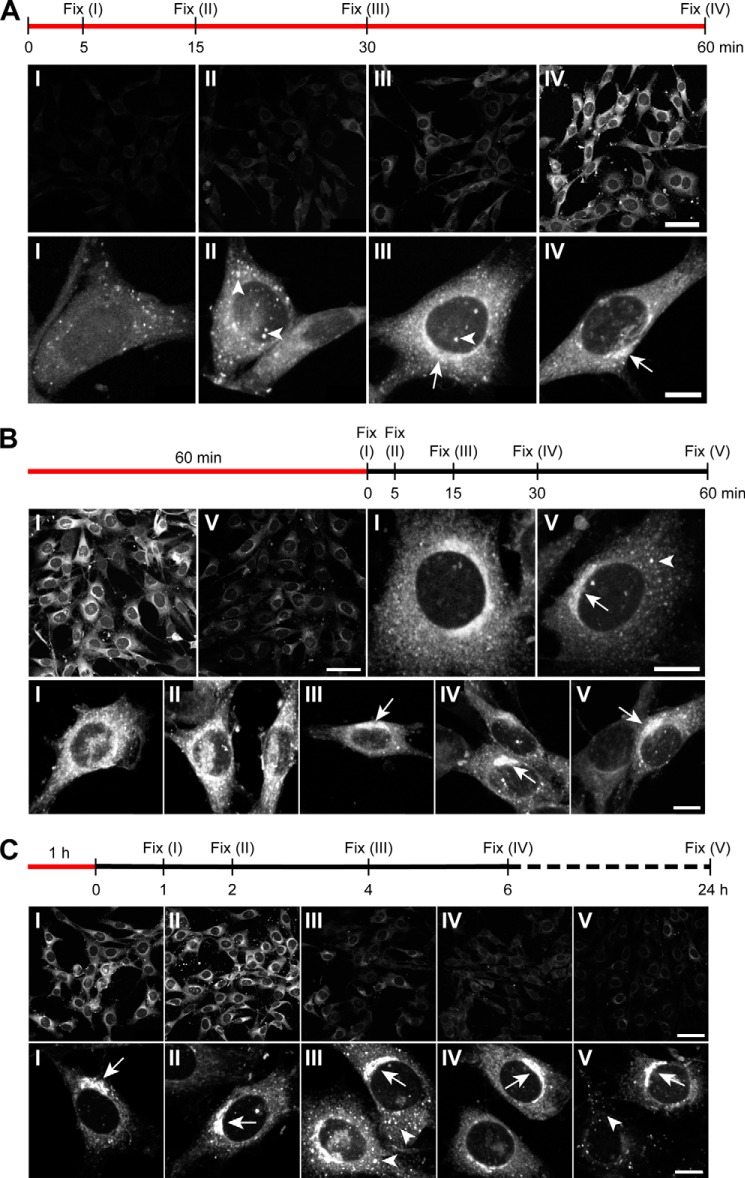
FIGURE 5.
Kinetics of 20(S)-yne accumulation and retention in the Golgi. The sequence of metabolic labeling prior to fixation is indicated above each panel, with red lines denoting the duration of the 20(S)-yne pulse and the black line denoting the duration of the sterol-free chase. The images at low magnification (top rows of each panel, scale bar, 50 μm) were taken at identical settings to compare intensities at different time points, whereas the high magnification images (bottom row of each panel, scale bar, 10 μm) were taken with different settings to optimally show the subcellular pattern of staining. Arrowheads and arrows indicate punctate and asymmetric perinuclear staining, respectively, and the roman numerals on the images correspond to the point on the timeline shown above each panel. A, 20(S)-yne signal intensity (top row) and distribution (bottom row) after various times of incubation. A representative image depicting the most prevalent staining pattern for each time point is shown in the bottom row. B and C show 20(S)-yne staining after a short and long chase, respectively.

