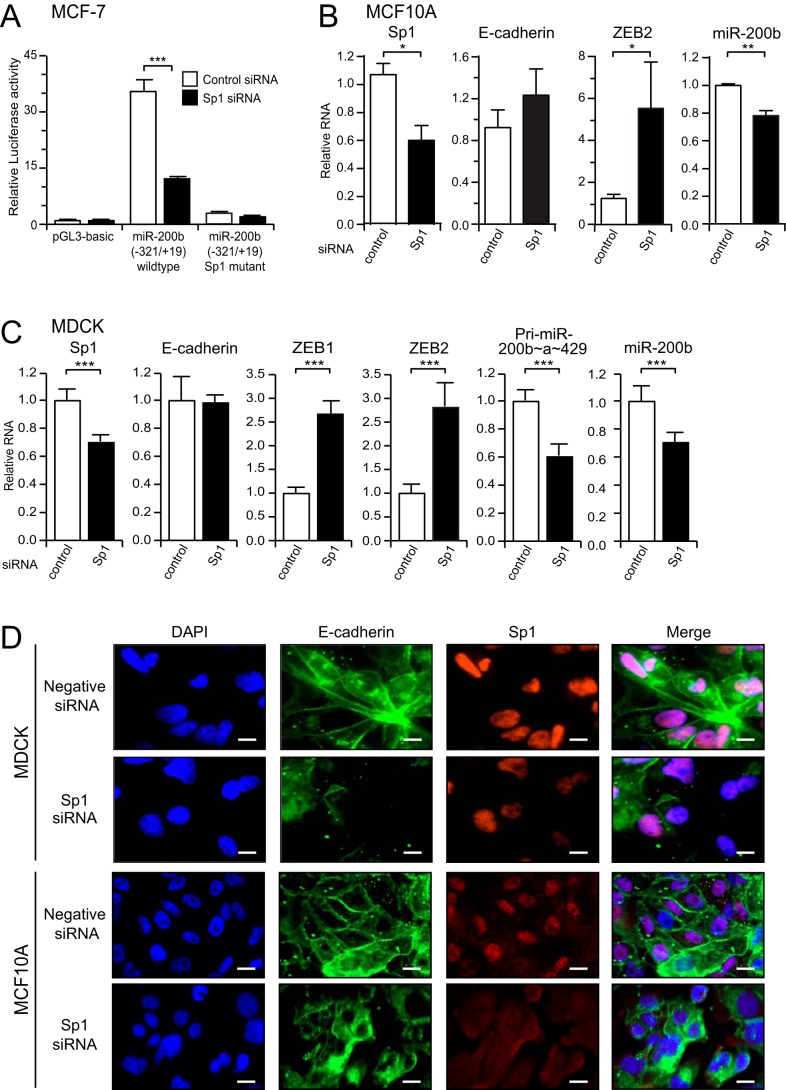
FIGURE 5.
Sp1 maintains miR-200 levels and the epithelial state of MDCK and MCF10A cells. A, activity of the −321/+19 miR-200b promoter reporters in MCF-7 cells after co-transfection with control or Sp1 siRNA. Data are expressed as relative luciferase activity ± S.E. from three independent experiments relative to the activity of the promoter-less reporter. Statistical significance (***, p < 0.001) was determined relative to indicated controls transfection using unpaired two-tailed Student's t test. Quantitative-PCR analysis of miR-200 and EMT markers in MCF10A (B) or MDCK (C) cells following transfection with control or Sp1 siRNAs for 6 or 3 days. Data are expressed as the mean relative to control siRNA + S.E. from three independent experiments. Statistical significance (*, p < 0.05; **, p < 0.01; ***, p < 0.001) was determined relative to indicated controls transfection using unpaired two-tailed Student's t test. D, immunofluorescence staining of MDCK or MCF10A cells for E-cadherin (green) or Sp1 (red) after treatment with control or Sp1 siRNAs for 3 days. DAPI staining (blue) was used to visualize nuclei. A merged image of the three is shown on the right hand panel. Scale bars indicate 10 μm.

