FIGURE 7.
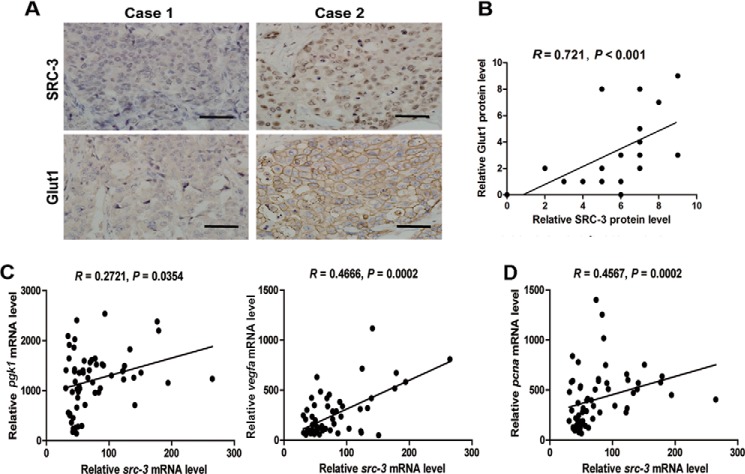
Correlation between expression levels of SRC, HIF1α target genes, and proliferative marker gene, pcna, in clinical human UBC samples. A, two representative UBC specimens for immunohistochemistry staining of SRC-3 and Glut1 in adjacent sections. Case 1, SRC-3 negative and Glut1 negative; case 2, positive nuclear staining of SRC-3 and positive membrane staining of Glut1. Bar, 100 μm. B, correlation between expression levels of SRC-3 and Glut1 in a cohort of human UBC specimens (n = 20, Spearman rank correlation coefficient). C and D, linear regression of src-3, HIF1α target genes (pgk1 and vegfa), and proliferative marker gene (pcna), using UBC samples from the GEO profiles database (GSE3167, n = 46).

