
FIGURE 4.
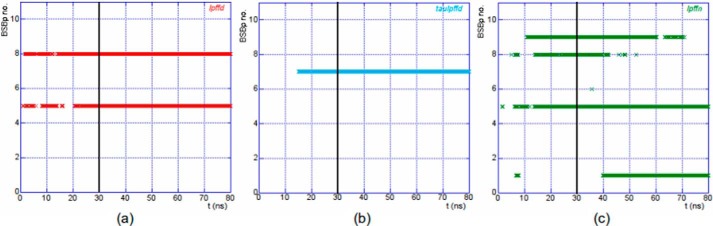
BSBps lying within 8 Å from the Aβ1–40 backbone are plotted as a function of simulation time. The black vertical line marks the time t = 30 ns. The color code is as in Fig. 1.
Official websites use .gov
A
.gov website belongs to an official
government organization in the United States.
Secure .gov websites use HTTPS
A lock (
) or https:// means you've safely
connected to the .gov website. Share sensitive
information only on official, secure websites.
BSBps lying within 8 Å from the Aβ1–40 backbone are plotted as a function of simulation time. The black vertical line marks the time t = 30 ns. The color code is as in Fig. 1.