FIGURE 2.
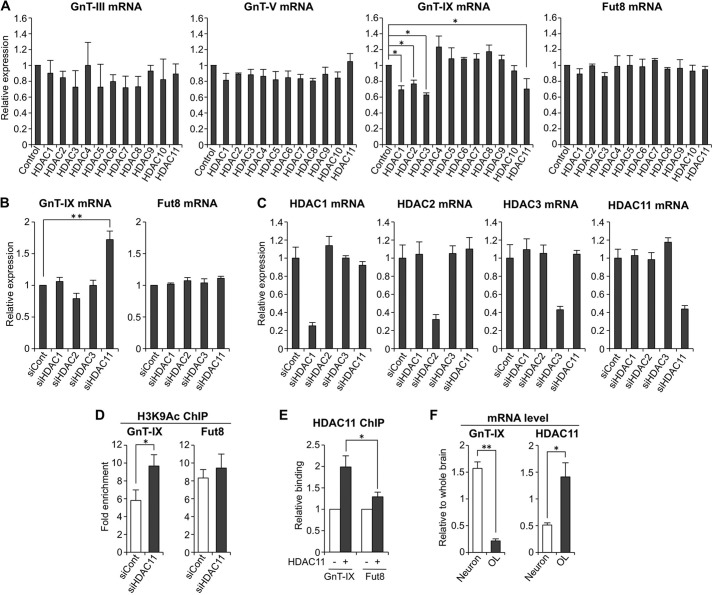
HDAC11 silences GnT-IX gene. A, total RNAs were extracted from Neuro2A cells (control) or transfectants stably expressing HDAC1–11. The mRNA levels of GnT-III, -V, and -IX and Fut8 were quantified and normalized to those of rRNA. The mRNA/rRNA levels of HDAC-expressing samples relative to those of control samples are shown (n = 3, *, p < 0.05, Tukey-Kramer's test). B, Neuro2A cells were treated with control siRNA (siCont), HDAC1, HDAC2, HDAC3, or HDAC11 siRNA for 24 h. Total RNAs were extracted, and the mRNA levels of GnT-IX and Fut8 were quantified and normalized to those of rRNA. The mRNA/rRNA levels of HDAC knockdown samples relative to those of control samples are shown (n = 3, **, p < 0.01, Tukey-Kramer's test). C, Neuro2A cells were treated with control siRNA, HDAC1, HDAC2, HDAC3, or HDAC11 siRNA for 24 h. Total RNAs were extracted, and the mRNA levels of Hdac1, Hdac2, Hdac3, and Hdac11 were quantified and normalized to those of rRNA. The mRNA/rRNA levels of HDAC knockdown samples relative to those of control samples are shown (n = 3). D, Neuro2A cells were treated with control siRNA or HDAC11 siRNA for 24 h, and then the levels of H3K9Ac around the transcriptional start sites of GnT-IX and Fut8 genes were analyzed by ChIP assays (n = 3, *, p < 0.05, Student's t test). E, HDAC11 tagged with 3×FLAG at its C terminus was overexpressed in Neuro2A cells. Recruitment of HDAC11-FLAG to the genomic region around the transcriptional start sites of GnT-IX and Fut8 genes was analyzed by ChIP assays with anti-FLAG antibody (M2)-conjugated beads. The precipitated DNA was analyzed by real-time PCR, and the amount of DNA from the transfectant (+) relative to that from mock-treated cells (−) is shown (n = 3, *, p < 0.05, Student's t test). F, mRNA levels of GnT-IX and Hdac11 were quantified and normalized to those of rRNA in mouse primary neurons (6 days in vitro) or in the oligodendrocyte-rich fraction (OL). The mRNA/rRNA levels are shown as relative values to those in whole brain from 20-week-old male mice (n = 3, *, p < 0.05, **, p < 0.01, Student's t test). All graphs show means ± S.E.

