FIGURE 3.

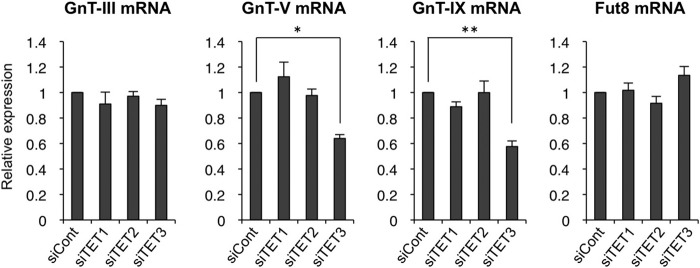
TET3 is involved in GnT-V and -IX expression. Neuro2A cells were treated with control siRNA (siCont), TET1, TET2, or TET3 siRNA for 24 h. Total RNAs were extracted, and the mRNA levels of GnT-III, -V, and -IX and Fut8 were quantified and normalized to those of rRNA. The mRNA/rRNA levels of TET knockdown samples relative to those of control samples are shown. All graphs show means ± S.E. (n = 3, *, p < 0.05, **, p < 0.01, Tukey-Kramer's test).
