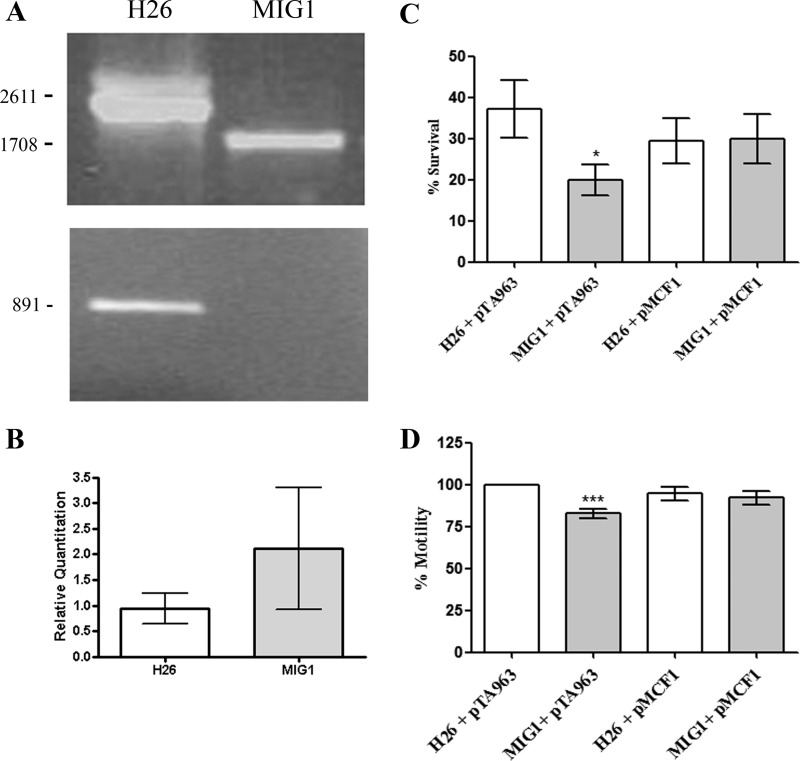
FIGURE 2.
Deletion of rhoII, phenotypic characterization, and complementation of the mutant. A, gene deletion was confirmed by colony-PCR using primers positioned upstream (Hvo0727KOverify5′) and downstream (Hvo0727KOverify3) the rhoII knock-out assembly (top) or with primers specific for rhoII coding sequence (NdeIfwRho2/Rho2RevNOSTOPHind; bottom). Amplicon size (bp) is indicated on the left. B, expression of the endV gene was quantified in H26 and MIG1 strains by real-time qPCR, as described under “Experimental Procedures.” C, fresh cultures of each strain were inoculated (A600 = 0.01) in CA medium containing 0.125 μg μl−1 novobiocin. After 24 h, A600 was measured, and the results were expressed as a percentage of the A600 of control tubes inoculated in CA without antibiotic. Data on this graph correspond to means of three independent experiments, performed in duplicate. *, value significantly different (p < 0.05) from that observed for H26 pTA963. D, single colonies were stab-inoculated in 0.25% agar CA medium, and after a 48-h incubation at 42 °C, motility halos were measured. The data were expressed as a percentage of the diameter of the H26 pTA963 strain. The plotted data correspond to three independent experiments in which 8–11 individual colonies of each strain were analyzed. ***, value significantly different from the H26 pTA963 strain (p < 0.01). Error bars, S.D.

