
FIGURE 4.
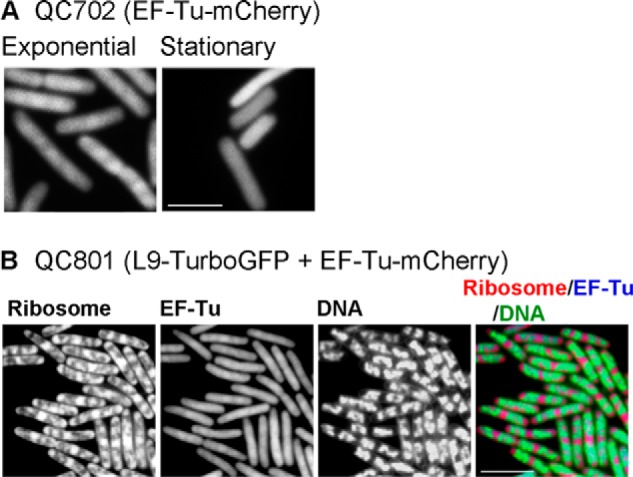
Distribution of EF-Tu in E. coli. A, distribution of EF-Tu-mCherry during exponential and stationary phase of growth. The images are taken using QC702 (EF-Tu-mCherry) cells. B, the distribution of Turbo-GFP tagged ribosomes, EF-Tu-mCherry, DAPI-stained DNA alone or in superposition of all three. The images were taken using QC801 (L9-TurboGFP + EF-Tu-mCherry) cells growing in the exponential phase. The bar indicates 5 μm.