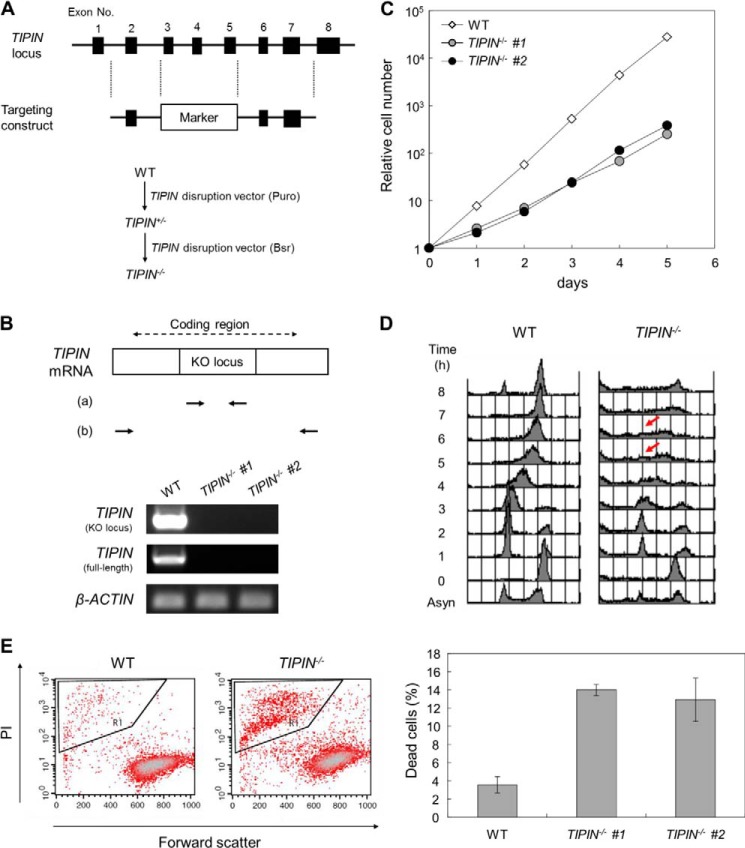
FIGURE 1.
Generation of TIPIN KO cells. A, schematic representation of the targeting construct for TIPIN gene disruption (upper) and the gene targeting procedure (lower). Closed boxes indicate exons. Puro and Bsr indicate the puromycin and blasticidin resistance genes, respectively. B, confirmation of TIPIN gene disruption by RT-PCR. Primer sets a and b were used to detect the KO locus by a targeting construct and full-length coding region in TIPIN mRNA. β-Actin was used as a control. C, growth curve of TIPIN KO cells. The number of viable cells was determined by flow cytometry. D, cell cycle analysis after release from M phase block. Cells were cultured in the presence of nocodazole (500 ng/ml) for 8 h. After release from M phase block, cells were collected at 1-h intervals, fixed, and stained with PI. DNA content was analyzed by flow cytometry. Arrows indicate S phase progression-delayed cells. Asyn, asynchronous. E, detection of dead cells. Cells were stained with PI, analyzed by flow cytometry (left), and quantitated (right). Forward scatter represents the size of cells. The outlined areas, which contain small sized cells heavily stained with PI, represent the population of dead cells. The error bars indicate S.D. from three independent experiments.

