
FIGURE 5.
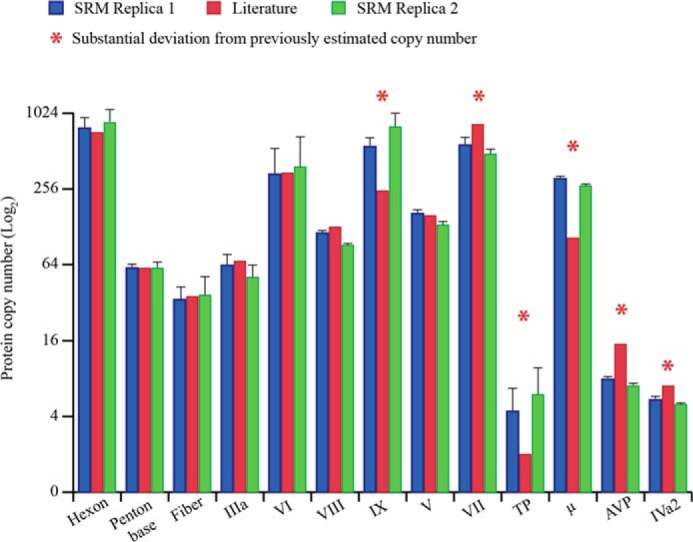
Stoichiometry of the proteins in HAdV (Ad5F35) particles. The bar chart reports the copy number (log2) for each of the HAdV proteins obtained by the SRM assay in two independent biological replicates (blue and red bars) and the estimated copy number known from literature (green bars). The error bars indicate the relative S.D. calculated from the quantitative values, retrieved by each of the SRM peptides employed for each protein.