FIGURE 4.
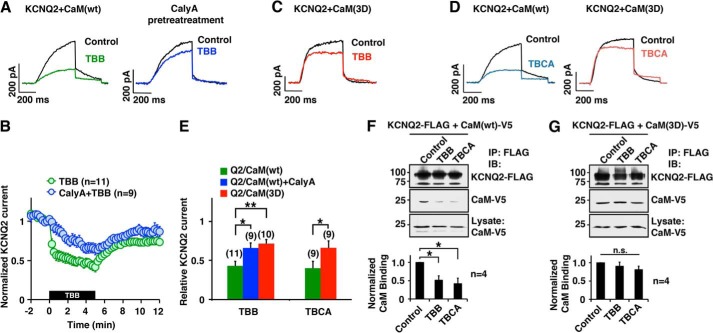
Pharmacological inhibition of CK2 reduced KCNQ2 current and CaM-KCNQ2 binding. A and B, current traces (A) and pooled results (B) showing KCNQ2 current suppression by CK2 inhibitor, TBB (10 μm, green), and its attenuation by pretreatment with phosphatase inhibitor, calyculin A (10 nm, blue). KCNQ2 currents were activated from a holding potential of −80 mV by two-step test pulses to −10 mV for 500 ms followed by −60 mV for 300 ms. Amplitudes of KCNQ2 currents were normalized to those at t = 0. The black box indicates the presence of TBB. C, KCNQ2 current traces compared before (black) and after (red) TBB treatment in the presence of CaM(3D). D, KCNQ2 current traces showing TBCA (5 μm) effect on the KCNQ2 currents (blue) and KCNQ2 co-expressed with CaM(3D) (red). E, summary of pooled data showing that treatment with CK2 inhibitor (10 μm TBB, 5 μm TBCA) suppressed KCNQ2 currents (green), and overexpression of CaM(3D) attenuated the effects of CK2 inhibitors (red). Relative KCNQ2 currents at t = 5 min as shown in B were normalized to current recorded at t = 0. *, p < 0.05; **, p < 0.01 by nonparametric ANOVA followed by Dunn's multiple comparisons test. F, co-immunoprecipitation (IP) showing that CK2 inhibitor treatments reduced the binding between KCNQ2 protein and CaM. Quantification from four independent experiments is shown. IB, immunoblotting. G, co-immunoprecipitation showing that overexpression of CaM(3D) maintained KCNQ2 channel binding in the presence of TBB or TBCA. Error bars show S.E.

