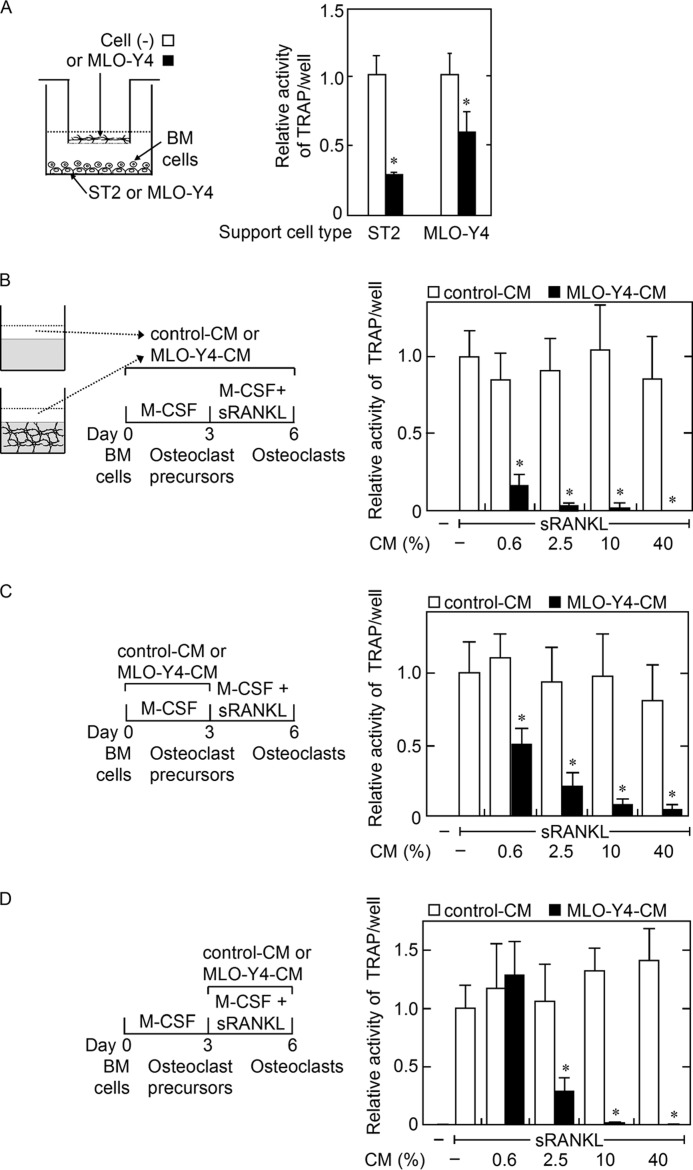
FIGURE 3.
A, effects of MLO-Y4 cells in cell culture inserts on osteoclastogenesis from BM cells supported by ST2 cells or MLO-Y4 cells. MLO-Y4 cells in cell culture inserts were cultured with BM cells and ST2 cells or MLO-Y4 cells in the presence of Dex (10 nm) and 1,25D3 (10 nm) (black bar). Cell culture inserts without cells were used as control (open bar). Osteoclastogenesis was evaluated based on the TRAP activity in the culture medium. The data are expressed as the mean ± S.E. (n = 4). *, p < 0.01 versus the insert cell (−) group. B–D, effects of MLO-Y4-CM on osteoclastogenesis in BM cell cultures. The effects of MLO-Y4-CM or control (Cont) CM on osteoclastogenesis were examined using a BM cell culture system. The cells were treated with the indicated concentration of CM during total culture period (B), during the first 3 days only (C) or during the latter 3 days only (D). Osteoclastogenesis was evaluated based on the TRAP activity in the culture medium. The data are expressed as the mean ± S.E. (n = 6). *, p < 0.01 versus control CM group at each CM concentration.

