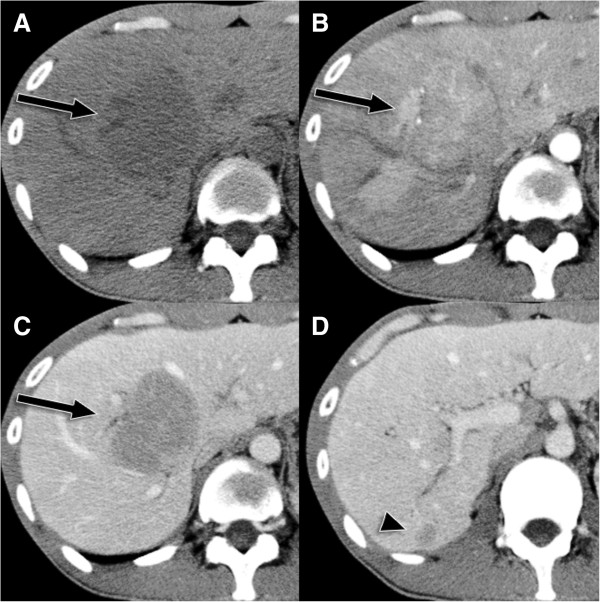
Figure 1.

Abdominal computed tomography. (A) Axial computed tomography (CT) imaging shows a liver lesion (arrow) with low attenuation. (B) On early-phase axial contrast-enhanced CT imaging, the lesion exhibits heterogeneous enhancement. (C) On portal-phase axial contrast-enhanced CT imaging, the lesion shows rapid washout in segment 5. (D) The segment 6 lesion exhibits a similar pattern (arrowhead).
