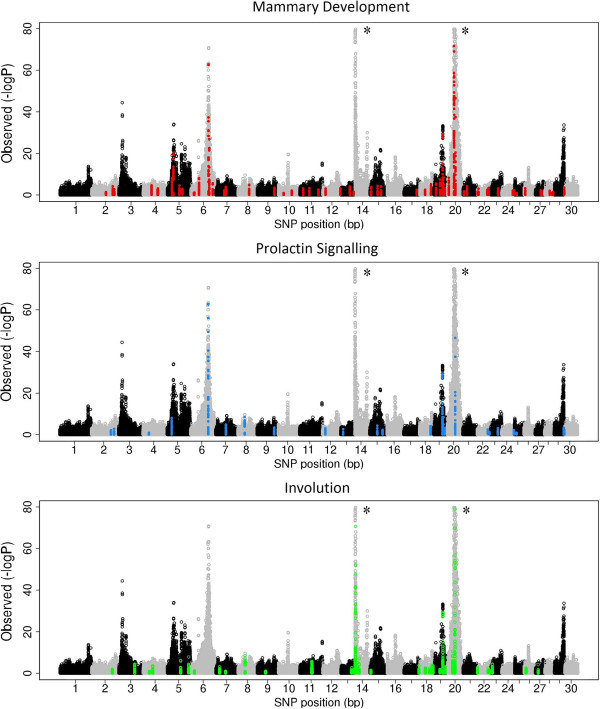
Figure 2.

GWAS of protein percentage in Holsteins and Jerseys. SNPs within the mammary development, prolactin signalling, and involution pathways are highlighted as red, blue and green dots, respectively; * identifies chromosomes 14 and 20, which have been scaled down to allow observation of smaller effects.
