
FIGURE 5.
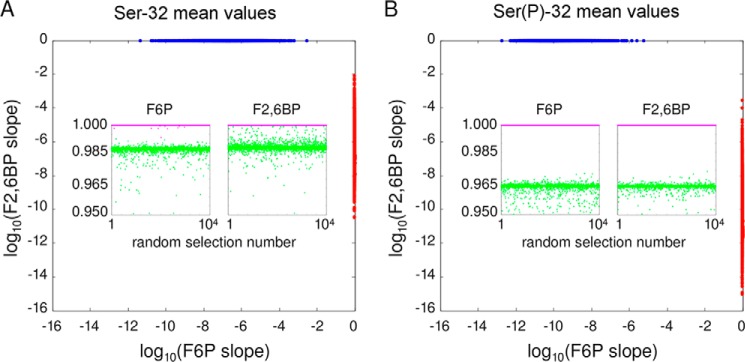
Sensitivity analysis. A, for 10,000 sets of rate constant values centered around the Ser-32 values in Table 1, randomly chosen as described under “Experimental Procedures,” the steady-state concentrations of F6P and F2,6BP were determined for increasing values of total fructose. The corresponding graphs were fitted to straight lines and the respective slopes are plotted on a log scale. Those sets for which t* < 1 are plotted in blue, and those for which t* > 1 are plotted in red. The former data points are clustered around (0, 1) but with a strongly asymmetric distribution, with the F2,6BP slope being almost exactly 1, whereas the F6P slopes occupy a broader range of values between 10−12 and 10−2. The latter data points are clustered around (1, 0) with a similarly asymmetric, but reversed, distribution. The two insets show the coefficient of determination for each linear fit, plotted against the selection number in which the corresponding rate constant values were found, from 1 to 10,000. The points with slope 1 are colored magenta, and those with slope 0 are colored green. They show a different pattern of correlation, with the former clustered almost exactly at 1.000, while the latter are more diffusively scattered around a lower value. B, same plot for the 10,000 rate constant values centered around the Ser(P)-32 values in Table 1.