
FIGURE 5.
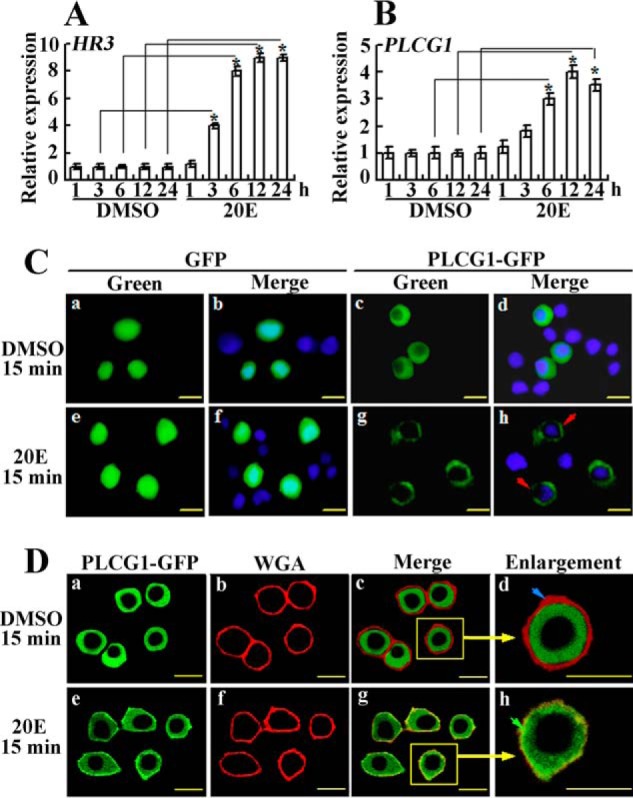
PLCG1 transcript level in larval midgut and PLCG1 protein migration toward the cell membrane in HaEpi cells depend on 20E stimulation. A and B, qRT-PCR analysis of the PLCG1 mRNA levels in the midgut of sixth instar 6-h larva after the injection of 500 ng of 20E. The negative control received an equivalent volume of DMSO. HR3 was used as a positive control for 20E induction. The statistical significance between samples was calculated using Student's t test from three repeats (*, p < 0.05). C, immunocytochemistry analysis of the response of the overexpression of PLCG1-GFP (green color) to 20E treatment. The observations were made under a fluorescence microscope. The red arrows denote PLCG1-GFP migrating toward the cell membrane after 15 min of treatment with 1 μm 20E. Cells overexpressing GFP were used as a control. The blue fluorescence indicates the cell nuclei stained with DAPI. D, migration of the overexpressed PLCG1-GFP toward the cell membrane was confirmed by a Zeiss LSM 700 laser confocal microscope. Then 1 μg/ml Alexa Fluor 594-conjugated WGA was incubated with the cells in DPBS for 15 min at room temperature to label the plasma membrane. The blue arrow indicates the cell membrane, and the green arrow indicates the superposition of the membrane and PLCG1-GFP. The yellow bars denote 20 μm.