
FIGURE 7.
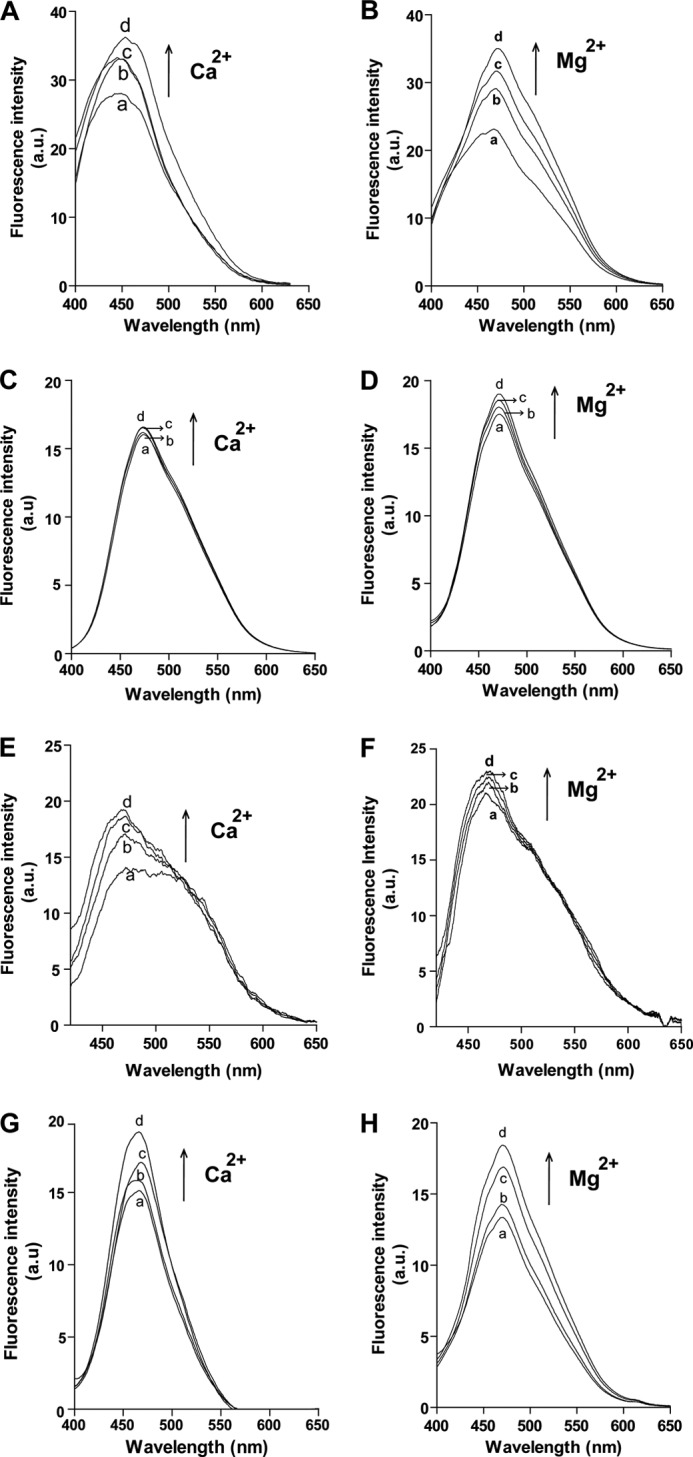
Monitoring surface hydrophobicity changes by ANS. A and B, ANS binding to hPLSCR1 in the presence of Ca2+ and Mg2+, respectively. a.u., arbitrary units. C and D, ANS binding to ΔPRD-hPLSCR1 in the presence of Ca2+ and Mg2+, respectively. E and F, ANS binding to hPLSCR2 in the presence of Ca2+ and Mg2+, respectively. G and H, ANS binding to PRD-hPLSCR2 in the presence of Ca2+ and Mg2+, respectively. Traces a, protein-ANS complex; traces b–d, respective ANS-protein complex in the presence of 2, 4, and 6 mm Ca2+or Mg2+, respectively. A red shift was observed in ANS-hPLSCR1 and ANS-PRD-hPLSCR2 fluorescence upon Ca2+ binding. Results are representative of at least three set of experiments (p < 0.05).