FIGURE 1.
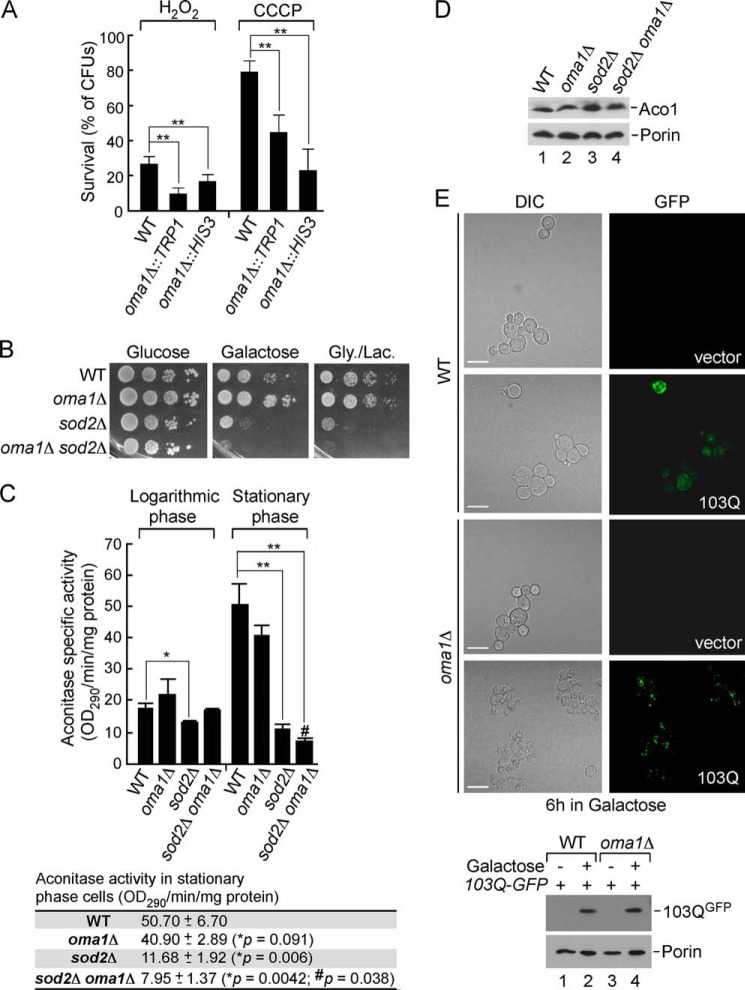
Loss of Oma1 affects cellular tolerance to mitochondrial stress stimuli. A, survival of WT and oma1Δ cells. Synchronized cultures were grown to mid-log phase and acutely treated with 1 mm H2O2 or chronically exposed to 45 μm CCCP. Samples were diluted to 300 cells and plated for survival onto glucose (YPD) plates, and the number of colony forming units was assessed after 2 days of incubation at 28 °C. The error bars indicate S.D. (n = 5); *, p < 0.05; **, p < 0.005 (unpaired t test, one-way analysis of variance). B, WT, oma1Δ, sod2Δ, and oma1Δ sod2Δ strains were grown to stationary phase in complete medium containing 2% glucose. Cells were serially diluted and spotted onto plates containing 2% glucose (YPD), galactose (YPGal), or glycerol/lactate (YPGL) as a sole carbon source. Pictures were taken after 2 (glucose plates) or 4 (galactose or glycerol/lactate plates) days of incubation at 28 °C. Gly., glycerol; Lac., lactate. C, aconitase activity in mitochondria isolated from the respective strains grown to logarithmic or stationary phase (mean values ± S.D., n = 3 biological replicates). The bottom panel shows actual data and p values for respective stationary phase cultures. *, WT versus indicated mutants; #, sod2Δ versus sod2Δ oma1Δ cells; unpaired t test, one-way analysis of variance. D, steady-state levels of aconitase (Aco1) and porin (loading control) in the strains described above. The TCA-precipitated whole cell extracts were subjected to SDS-PAGE and analyzed by immunoblotting with the respective antibodies. E, top panel, visualization of Htt-103Q-GFP in WT and oma1Δ cells. Synchronized cells bearing an empty YIp vector or an integrative plasmid with GAL1 promoter-driven Htt-103Q-GFP were pregrown in YPGL + 0.2% glucose. The cultures were then transferred into galactose-containing medium and incubated for 6 h at 28 °C to induce Htt-103Q-GFP expression and assessed by confocal microscopy. The scale bars indicate 5 μm. Bottom panel, immunoblot analysis of Htt-103Q-GFP levels in WT and oma1Δ cells. DIC, differential interference contrast.

