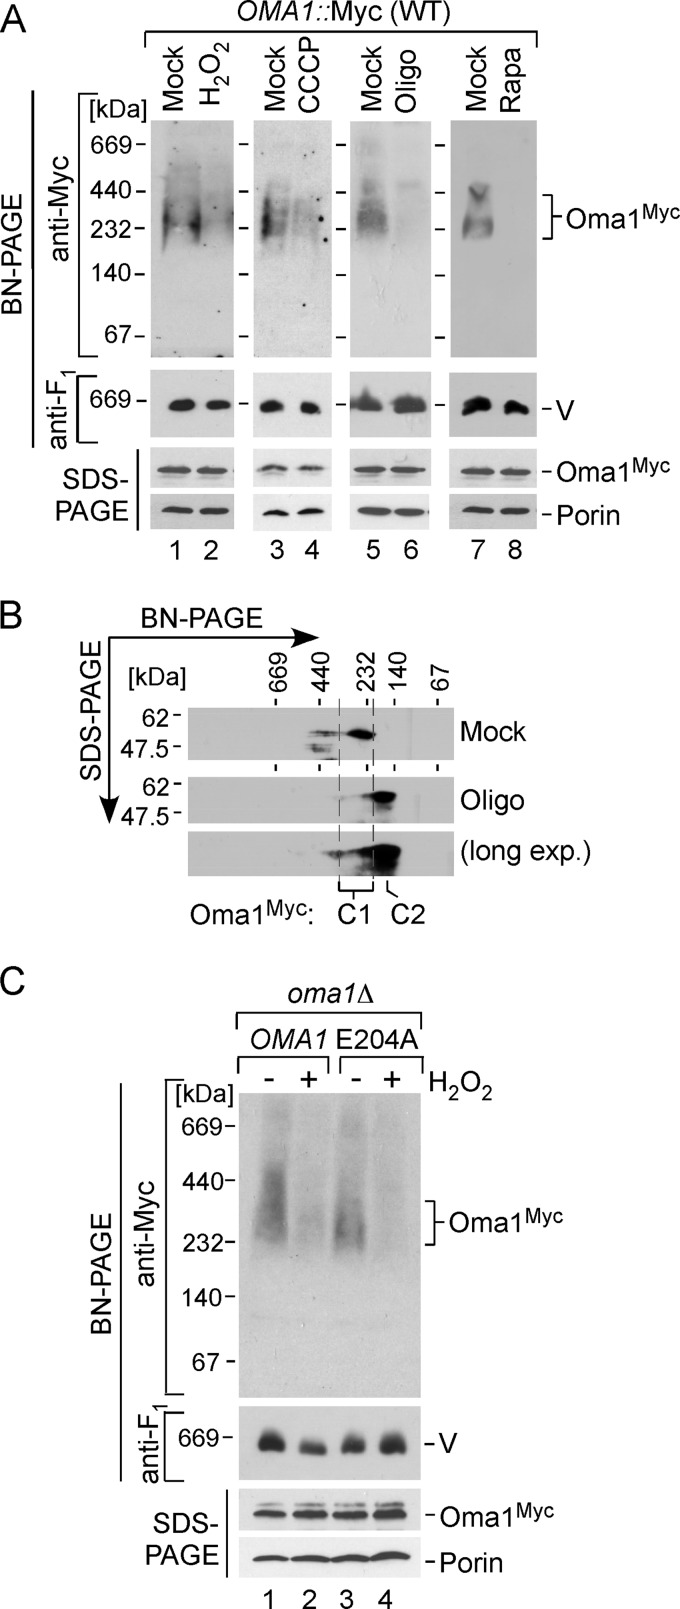
FIGURE 4.
Oma1 complex is perturbed by various mitochondrial stress stimuli. A, BN-PAGE and SDS-PAGE analyses of mitochondria isolated from Oma1–13Myc endogenously tagged cells that have been grown to the mid-logarithmic phase and either mock treated or incubated with 4 mm H2O2 for 2 h (lanes 1 and 2), 45 μm CCCP for 2 h (lanes 3 and 4), 4 μm oligomycin (Oligo) for 8 h (lanes 5 and 6), or 30 ng/ml rapamycin (Rapa) for 2 h (lanes 7 and 8). V, complex V. B, representative two-dimensional BN/SDS-PAGE analysis of mitochondria (300 μg) from Oma1–13Myc-tagged WT cells grown with (Oligo) or without (Mock) 4 μm oligomycin as described for A. Protein complexes were separated by BN-PAGE in the first dimension, subjected to denaturing SDS-PAGE in the second dimension, and analyzed by immunoblot. C1 and C2 denote the basal and stress-generated species of Oma1. long exp., long exposure. C, the oma1Δ cells bearing WT Oma1 or E204A catalytic mutant were cultured as above and incubated in the presence (+) or absence (−) of 4 mm H2O2. Purified mitochondria (70 μg) were solubilized with digitonin and subjected to either native or denaturing electrophoresis. Separated protein complexes or denatured proteins were visualized as in Fig. 3C.

