
FIGURE 7.
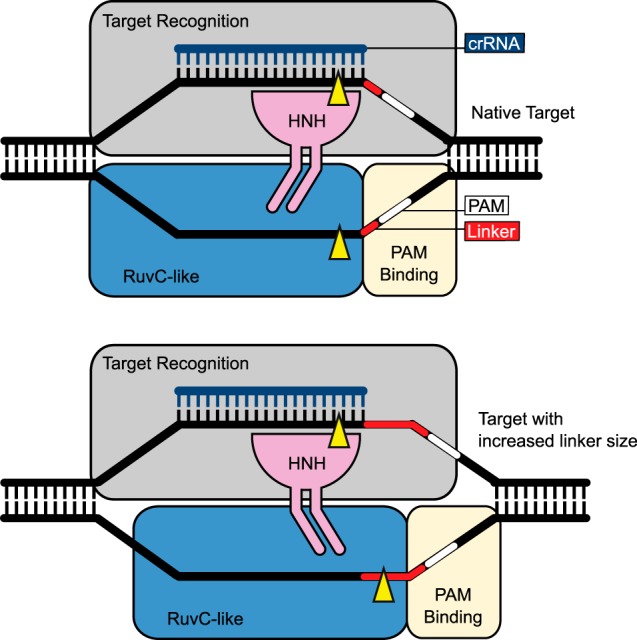
Schematic representation of cut site selection by the HNH and RuvC-like domains of Cas9. Top, a schematic with a native DNA target; bottom, a schematic with a DNA target containing a longer length linker. Cleavage sites on the complementary and noncomplementary strands are indicated by yellow arrows. For clarity, the tracrRNA is not shown.