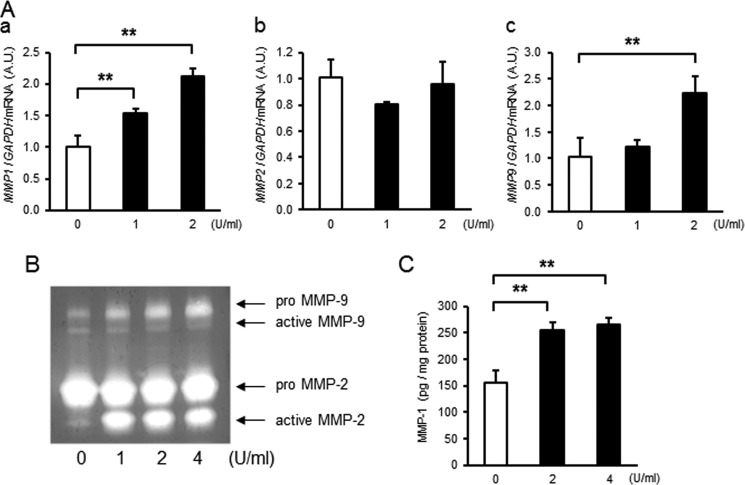
FIGURE 5.
Effect of thrombin on primary decidual cells. A, primary decidual cells were treated with various doses of thrombin for 48 h and analyzed for relative levels of MMP1 (a), MMP2 (b), or MMP9 (c) mRNA. A.U., arbitrary units. B, gelatin zymography of conditioned media (2 μg of protein) from decidual cells treated with different doses of thrombin for 48 h. C, MMP-1 enzymatic activity in conditioned media from thrombin-treated decidual cells. Results represent mean ± S.D. (error bars), n = 3 in each group. **, p < 0.01 compared with control (0 units/ml).

