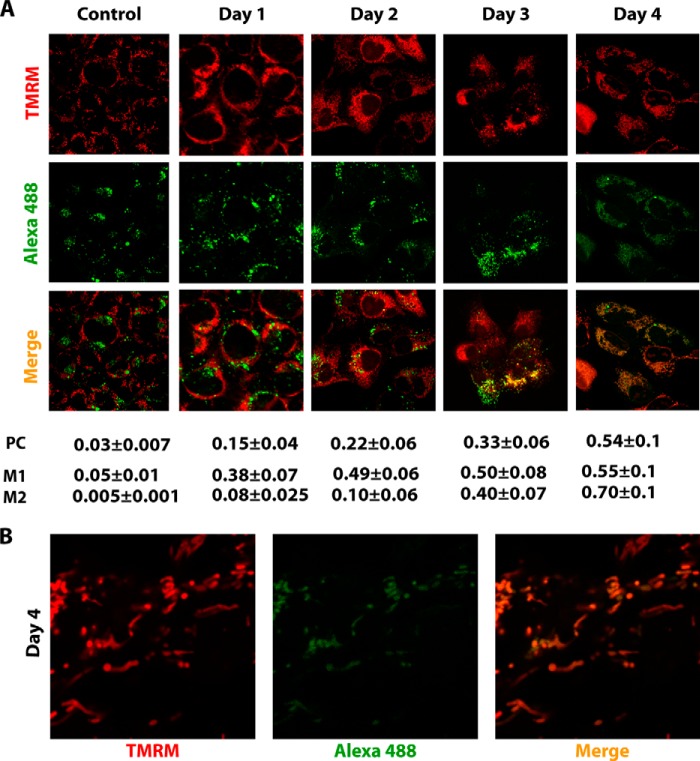
FIGURE 3.
Confocal microscopy of human cells transfected with fluorescently labeled RNA. A, confocal microscopy of 143B cells transfected with Alexa Fluor 488-labeled FD20H RNA (green) at various time periods after transfection (as indicated above the panels). Control, cells transfected with Alexa Fluor 488-5-UTP-labeled RNA, which is not imported into mitochondria, 3 days post transfection. TMRM, visualization of mitochondrial network by red staining. Below the panels, shown is quantification of RNA co-localization with mitochondria, estimated for multiple cells and 6–10 optical sections in two independent experiments. PC, Pearson's correlation coefficient; M1 and M2, Manders' overlap coefficients, representing the percentage of green fluorescence co-localized with red fluorescence (for M1) and the percentage of red fluorescence co-localization with green fluorescence (for M2). B, magnification of the image corresponding to day 4 post transfection. A three-dimensional reconstruction of the confocal microscopy image by ImageJ software is presented in the supplemental movies.

