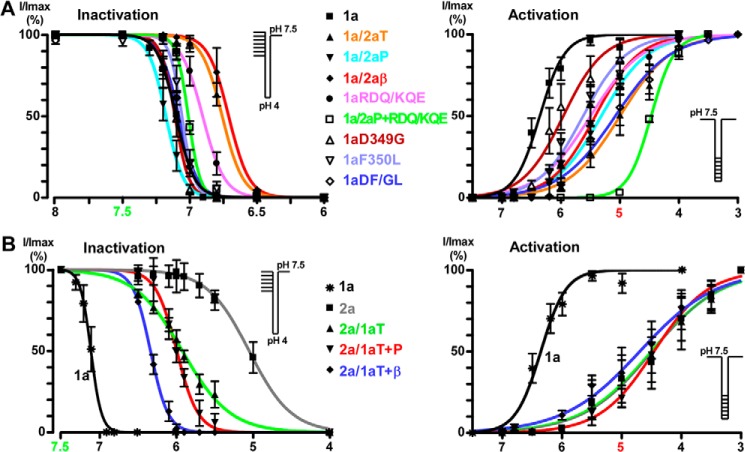
FIGURE 2.
pH-dependent activation and inactivation of the chimera and mutant currents. ASIC1a-based and ASIC2a-based chimeras are shown in A and B, respectively. Solid lines are fits of the mean values of each data point to a sigmoidal dose-response curve with variable slope. See Table 1 for pH0.5 of activation and inactivation; the protocol is shown in the inset. Data points and error bars represent the mean ± S.E.

