
FIGURE 6.
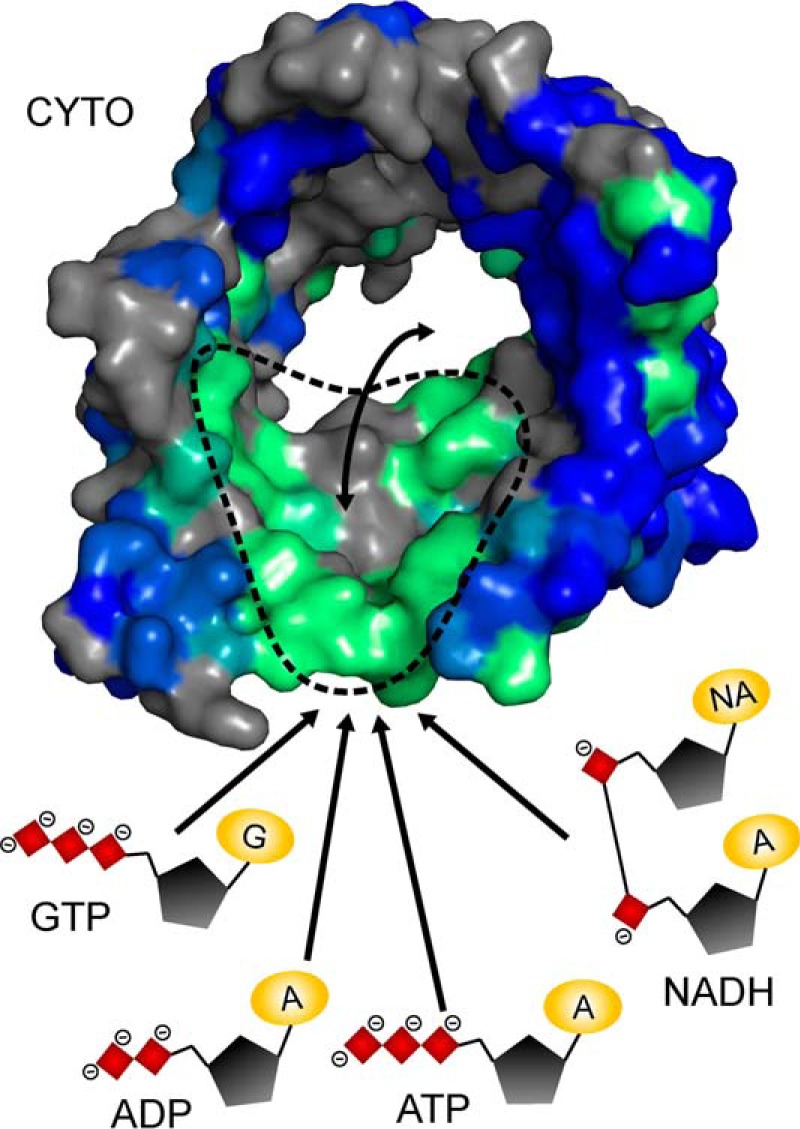
The hVDAC1 nucleotide binding region acts as a low affinity selectivity filter for metabolite permeation. hVDAC1 is shown as a surface representation viewed from the cytosolic pore entrance and colored as in Fig. 1F. Nucleotides are displayed as schematic (red, phosphate groups; black, ribose; yellow, adenine base (A)/guanine base (G)/nicotinamide (NA)). Arrows indicate interactions of nucleotides with the nucleotide binding region (green surface, approximate location encircled by dashed line) and permeation through the pore.