
FIGURE 4.
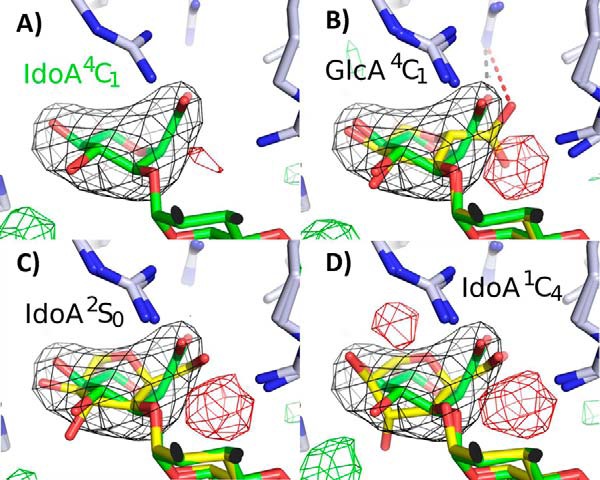
Refinement of different conformations of the acceptor saccharide. A, refinement of saccharide E as IdoA in the 4C1 conformation (green). B–D, refinement of saccharide E as either GlcA in the 4C1 conformation, IdoA 2S0, or IdoA 1C4, respectively (yellow) superimposed with the IdoA 4C1 structure (green). The simulated annealing omit Fo − Fc map contoured at 4.0σ is displayed in black. Positive Fo − Fc density from each respective refinement is shown in green (3.0σ), and negative density (3.0σ) is shown in red. In B the black dashed line represents a salt bridge (2.9 Å) between the IdoA and Arg-189. For GlcA this distance is 4.0 Å (red dashed line) and thus likely does not form a salt bridge.