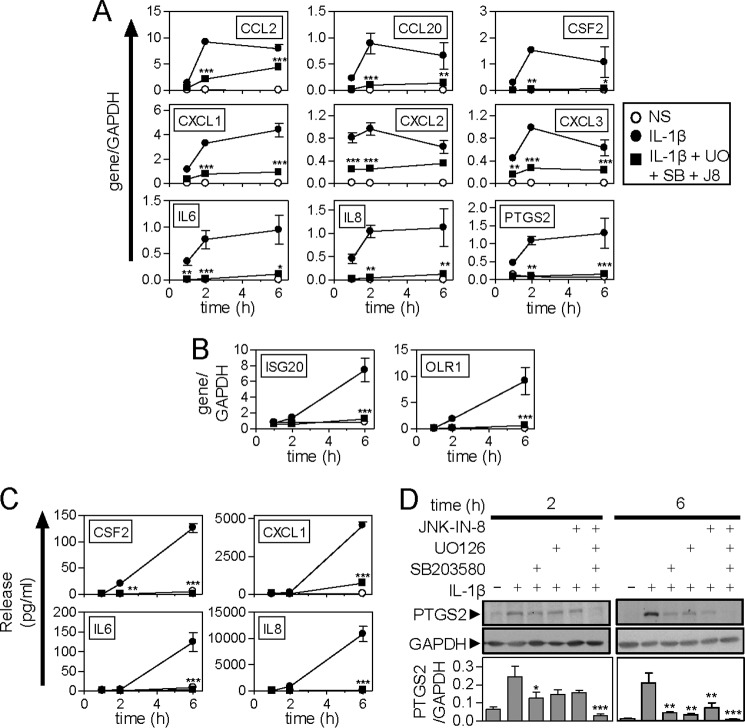
FIGURE 3.
Effect of MAPK inhibitors on IL1B-induced inflammatory gene expression. A and B, A549 cells were not stimulated (NS) (○), treated with IL1B (1 ng/ml) (●), or pre-treated with a combination of UO126, SB203580 plus JNK inhibitor 8 each at 10 μm (UO + SB + J8) for 30 min prior to IL1B stimulation (■). Cells were harvested after 1, 2, or 6 h for real-time PCR analysis of the indicated genes and GAPDH. Data (n = 4) were normalized to GAPDH and plotted as mean ± S.E. Early phase genes are shown in A and delayed response genes in B. C, cells were treated as in A and the supernatants were harvested after 1, 2, or 6 h for measurement of cytokine/chemokine release. Data (n = 4) expressed in picograms/ml are plotted as mean ± S.E. D, cells were treated as in A and harvested at the times indicated for Western blot analysis of PTGS2 and GAPDH. Representative blots are shown. Following densitometric analysis, data (n = 4), normalized to GAPDH, are plotted as mean ± S.E. Significance, relative to time-matched IL1B-treated samples, was tested by ANOVA with a Bonferroni post-test. *, p < 0.05; **, p < 0.01; ***, p < 0.001.

