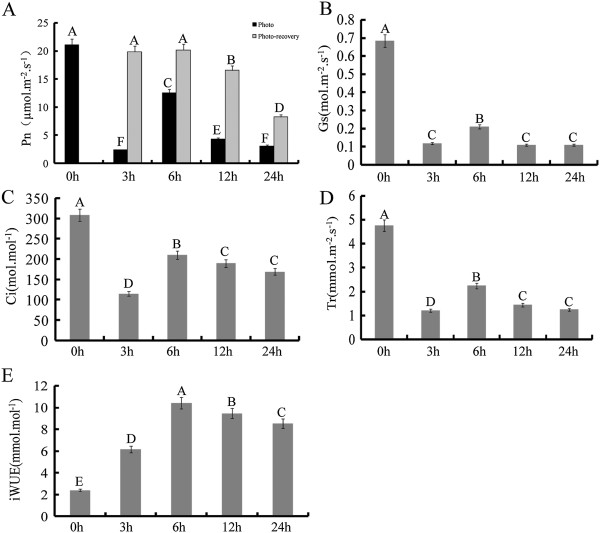
Figure 1.

Changes in gas exchange at high temperatures. A: Pn represents photosynthetic rate; B: Gs represents stomatal conductance; C: Ci represents intercellular CO2 concentration; D: Tr represents transpiration rate; E: iWUE represents intrinsic water use efficiency. 0h indicates the control group without high temperature treatment. 3-24h indicates different times of exposure to heat stress. Error bars represent standard error. Different letters on error bars indicate significant differences at P < 0.01. Symbols are the same in the following figures.
