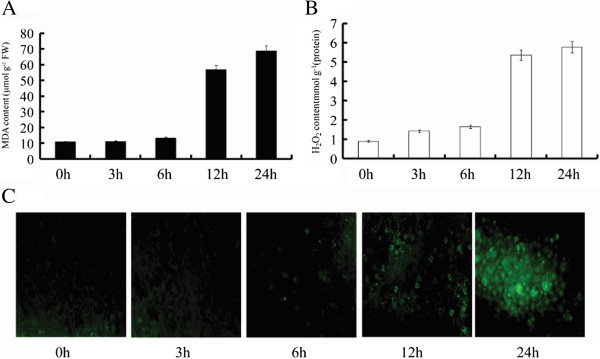
Figure 4.

Concentration of MDA and H2O2 in leaves of poplar under high temperature. A: concentration of MDA under heat stress. B: concentration of H2O2 under heat stress. C: the changes of H2O2 under heat stress were detected by H2O2-specific fluorescent probe H2DCF-DA (green). 0h indicates control group without high temperature treatment. 3-24h indicates different times of exposure to heat stress. Concentrations are presented as means ± standard error, and n = 3.
