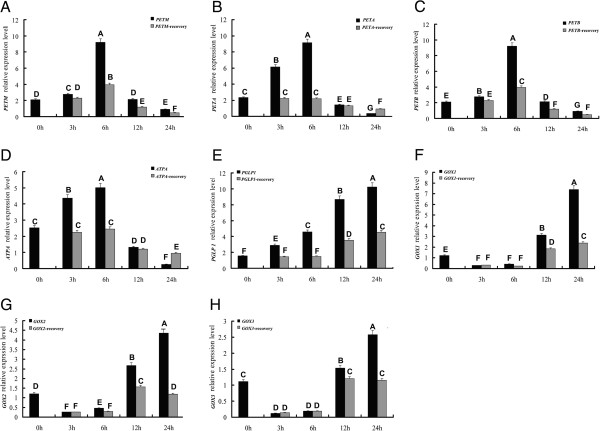
Figure 7.

Quantitative RT-PCR of eight candidate genes related to electron transfers and H2O2 production under heat stress. A-H represents the expression pattern of PETM, PETA, PETB, ATPA, PGLP1, GOX1, GOX2 and GOX3 genes respectively. Transcript levels are normalized to PtACTIN and error bars represent standard error. Black column indicates gene expression under heat stress; gray column indicates gene expression after recovery.
