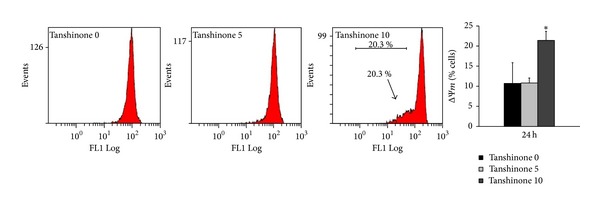
Figure 4.

Influence of Tan IIA on the mitochondrial membrane potential (ΔΨm) of KB cells. KB cells were treated with Tan IIA (0, 5, and 10 μg/mL) for 24 hours. After DiOC6 staining, the changes of the mitochondrial membrane potential were measured using flow cytometry. Values are the mean ± SD of 4 independent experiments. ∗ indicates P < 0.05.
