
Fig. 5.
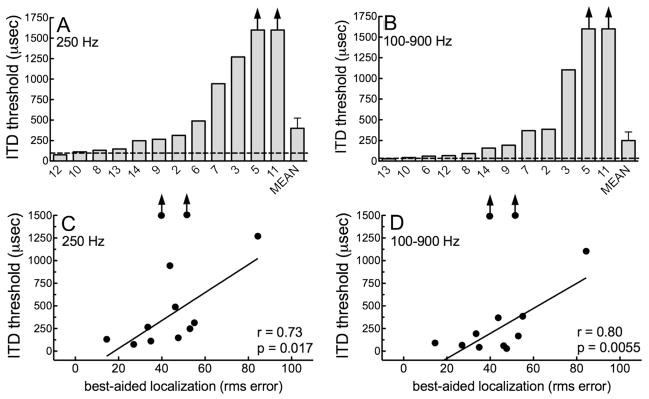
Individual and mean ITD thresholds, in microseconds, for (A) 250 Hz and (B) 100–900 Hz bandpass noise. ITD thresholds are also shown as a function of rms localization error in the best-aided condition, for (C) 250 Hz and (D) 100–900 Hz. For (A) and (B) means were calculated only for those participants who had a tracked threshold. Regression analysis did not include results for the listeners with normal hearing nor the data points representing those participants unable to track ITD thresholds.