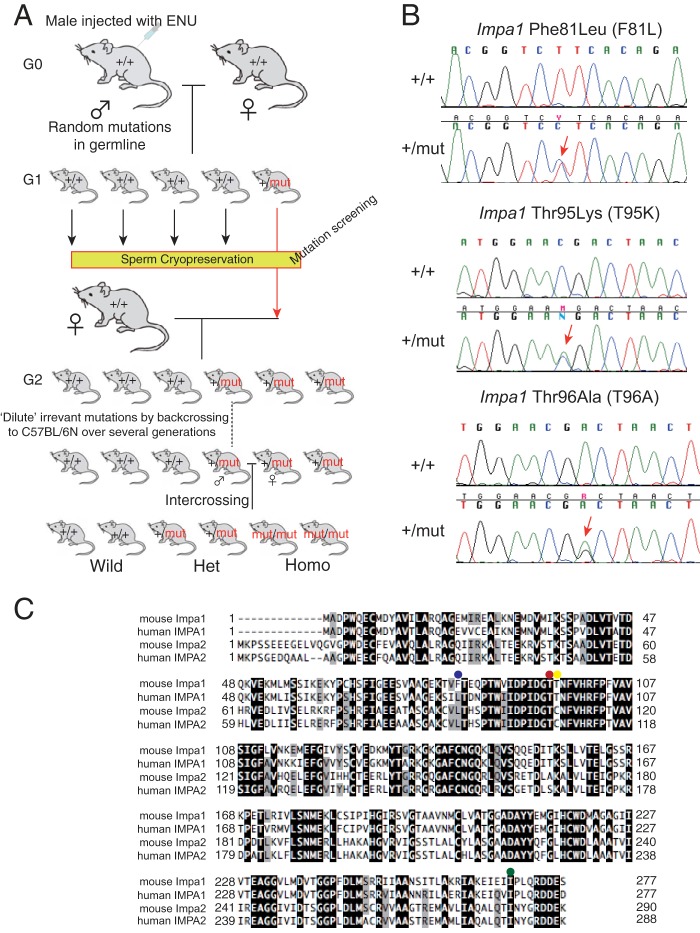
FIGURE 1.
ENU-induced mutations in Impa1. A, schematic representation of the gene-driven ENU mutagenesis system. The library was screened for mutations in the two IMPase genes. B, sequence data for genomic DNA from three Impa1 mutants. Note that each mutant strain (G0) is a heterozygote for the corresponding mutation. Arrows indicate the position of the mutation. C, amino acid sequence alignment of mouse and human IMPases. Identical and conserved amino acids are highlighted in black and gray, respectively. Positions of missense mutations are indicated by colored dots as follows: blue, Impa1 Phe-81; red, Impa1 Thr-95; yellow, Impa1 Thr-96; and green, Impa2 Ile-282.

