
FIGURE 1.
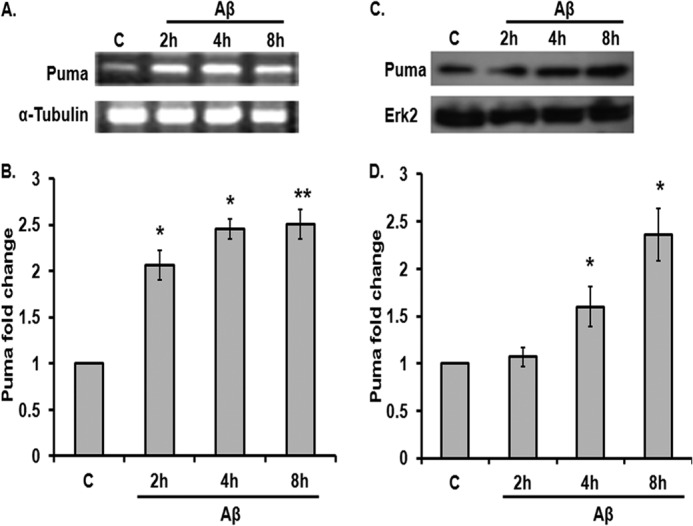
Puma is induced by Aβ in cortical neurons. A, rat cortical neurons (7 days in vitro) were subjected to oligomeric Aβ (1.5 μm) for the indicated times, and total RNA was isolated, reverse-transcribed, and analyzed by semiquantitative PCR for Puma transcripts. α-Tubulin was used as a loading control. B, graphical representation of changes in Puma transcript level upon Aβ (1.5 μm) treatment on primary cultured rat cortical neurons at the indicated times by real-time PCR. 18 S was used as a loading control. Data are presented as -fold increase relative to untreated control (C) and represent mean ± S.E. of three independent experiments. *, p < 0.05; **, p < 0.01. C, cortical neurons were subjected to Aβ (1.5 μm) for the indicated times, and total tissue lysates were analyzed by Western blot for Puma level. A representative immunoblot shows Puma protein level at the indicated time points. ERK2 was used as a loading control. D, graphical representation of -fold increase of Puma protein level after Aβ treatment at different time points expressed relative to untreated control. Data represent mean ± S.E. (error bars) of three experiments. *, statistically significant differences from 0 h control; p < 0.05.