
FIGURE 7.
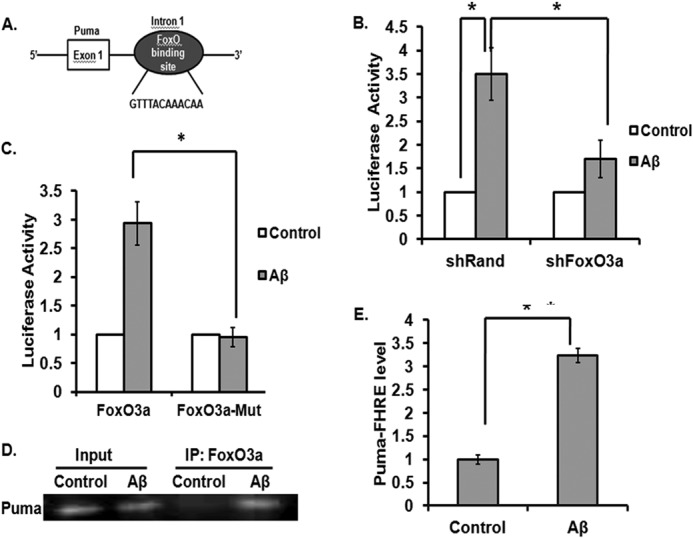
FoxO3a directly binds with intron 1 of the rat Puma gene and regulates its induction upon Aβ treatment. A, schematic representation of Puma-luc reporter consisting of intron-1 of the rat Puma gene. B, cortical neurons were co-transfected with 0.3 μg of Puma-luc reporter and 0.1 μg of Renilla luciferase expression construct pRL-CMV with 0.3 μg of either shRand (control) or shFoxO3a. The cultures were maintained for 48 h and then subjected to overnight Aβ treatment, after which luciferase activity was assayed and represented as -fold change of luciferase activity. Data represent mean ± S.E. (error bars) of four experiments. *, p < 0.05. C, cortical neurons were co-transfected with 0.4 μg of either wild type Puma-luc reporter or FoxO3a-mutated construct and 0.1 μg of Renilla luciferase expression construct pRL-CMV. The cultures were maintained for 48 h and then subjected to overnight Aβ treatment, after which luciferase activity was assayed and represented as -fold change of luciferase activity. Data represent mean ± S.E. of four experiments. *, p < 0.05. D, primary cultures of rat cortical neurons were treated with or without Aβ for 8 h. An equal number of cells were processed for ChIP assay using anti-FoxO3a antibody for immunoprecipitation. The immunoprecipitated materials were subjected to PCR using primers against the portion of the Puma promoter that flanks the FoxO3a-binding site. PCR products were verified by agarose gel electrophoresis. Templates were DNA from cells before ChIP (Input) or DNA from immunoprecipitated (IP) materials. PCR assays were conducted after ChIP, using samples from cells that were either left untreated (Control) or treated with Aβ. E, graphical representation of FoxO3a association with the Puma gene. Quantitative PCR was performed using material derived from cultured cortical neurons treated as in D. Association of FoxO3a with Puma Forkhead response element (Puma FHRE level) in the presence or absence of Aβ was determined by quantitative PCR after ChIP, using samples from cells that were either left untreated (Control) or treated with Aβ. Numbers on the y axis represent the levels of FoxO3a association with the Puma promoter region after normalizing to Ct values from input samples. Data shown are means ± S.E. *, p < 0.05.