
Figure 4.
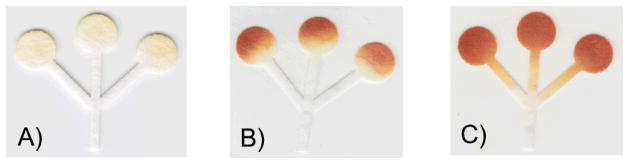
Images displaying (A) the lowest color intensity (grade 3F), (B) the largest color gradient (grade 1 CHR), and (C) the best color intensity with the most uniformity (grade 1 CHR). The color generated inside the channels (C) is attributed to excess color reagent spotted on detection zone.