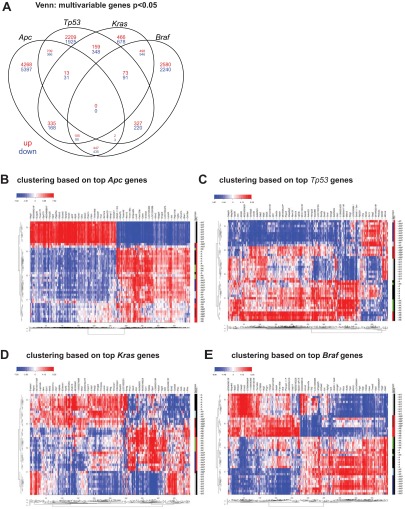
Fig. 2.
Multivariable analysis identifies genes associated with each allele from the GEMM cohort. (A) Venn diagram depicting the number of unique or shared genes associated with each GEMM allele. Red, upregulated genes; blue, downregulated genes. (B–E) Clustering of GEMMs based on expression profiles of genes associated with each allele.

