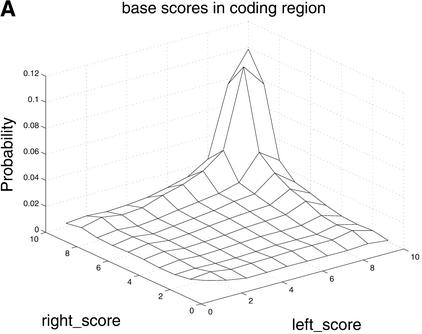
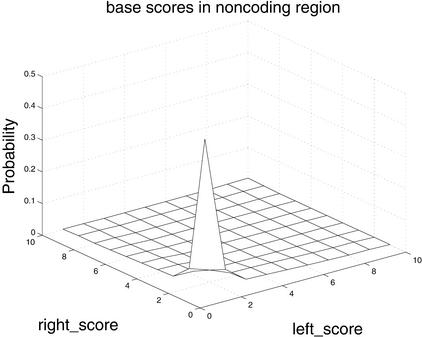
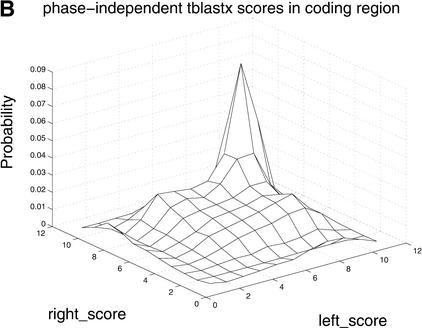
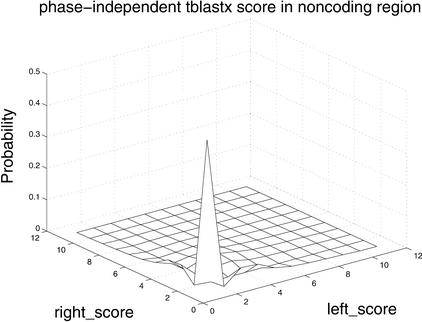
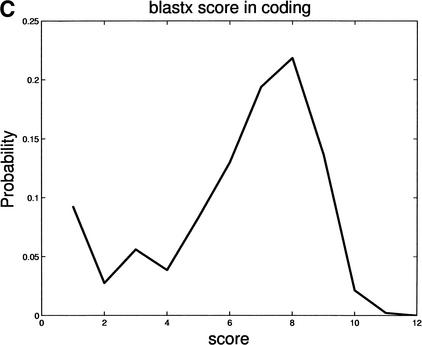
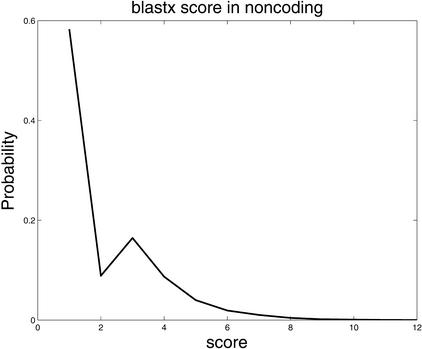
Figure 4.
Differences in distributions of comparative scores in coding and noncoding regions indicate their potential utility. Shown are (A) distributions of RBS and LBS Pr(RBS,LBS| coding) and Pr(RBS,LBS| noncoding); (B) distributions of phase-independent TBLASTX scores; and (C) distributions of BLASTX scores.

