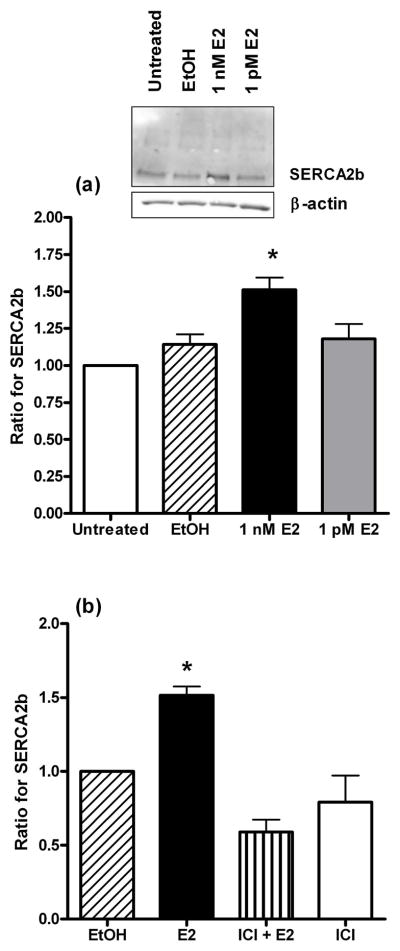
Fig. 1.

(a) The effect of estrogen on the protein expression of SERCA2b. The data represent the ratio of the band intensity for the EtOH and estrogen (E2) groups compared to the untreated group for each Western blot. The insert shows a representative raw Western blot for SERCA2b and the loading control, β-actin. * indicates P < 0.05, n = 6. (b) SERCA2b expression in the presence of estrogen and the estrogen receptor α/β antagonist, ICI 182,780. The data represent the ratio of the band intensity for the experimental groups compared to the EtOH group for each Western blot. * indicates P < 0.05, n = 4. In both (a) and (b) the endothelium was intact.
