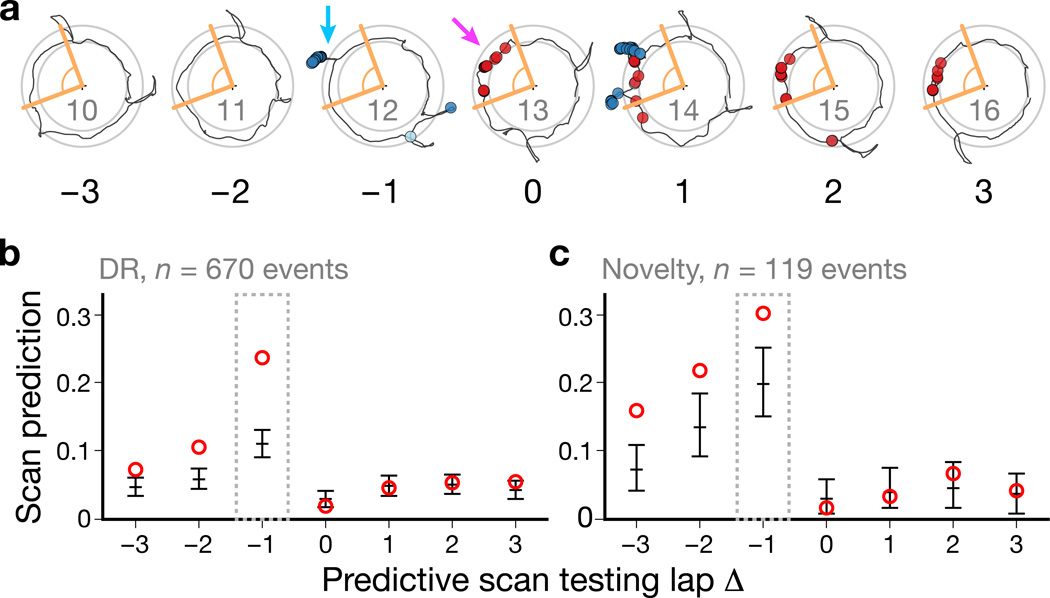
Figure 4. Predictive analysis of the scan–potentiation relationship.
Scan Prediction Index values were computed across potentiation events for a range of scan testing laps relative to each event. a, Track-angle windows (orange) around a potentiation event (magenta arrow) were used to test whether an active scan (e.g., cyan arrow) was predictive for that event. b–c, SPIs across scan testing laps for the DR (b) and novelty (c) experiments. The highest values of the index occurred for the lap immediately preceding the potentiation event (lap Δ = –1). Scan firing on subsequent laps was within the expected values based on the place-field activity of the cell. Circles: observed; error bars: chance levels, mean ± empirical 95% c.i. derived from simulations (Supplementary Fig. 9).

