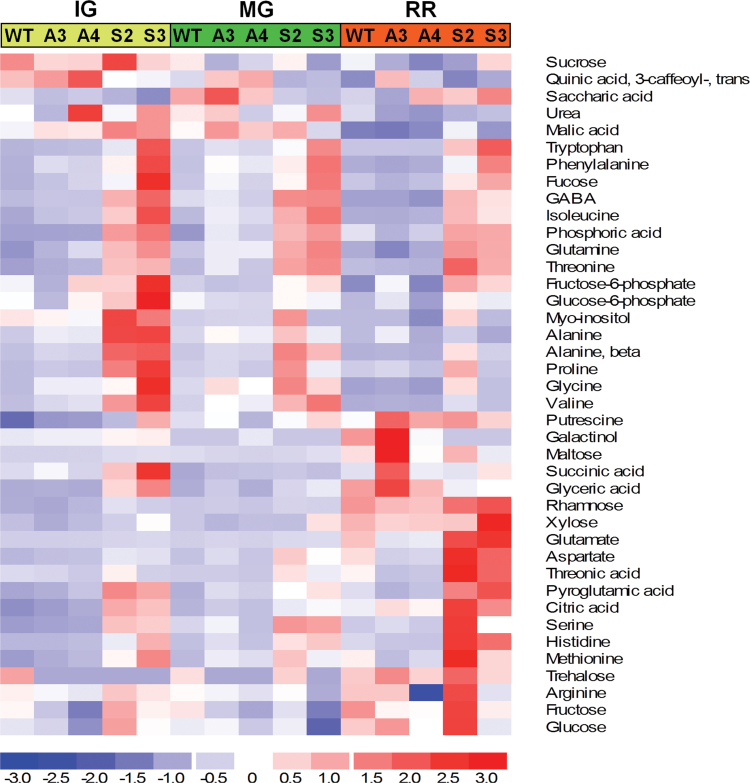
Fig. 2.
Metabolic profiles of tomato WT and SlAREB1 transgenic fruit pericarp tissues. Heatmap of metabolite contents in fruits harvested at the immature green (IG), mature green (MG), and ripe red (RR) stage from wild-type (WT), antisense (A3 and A4), and overexpressing (S2 and S3) lines (four biological replicates). Colour changes represent the median of log 2 values obtained with the DChip software (http://www.hsph.harvard.edu/cli/complab/dchip/).

