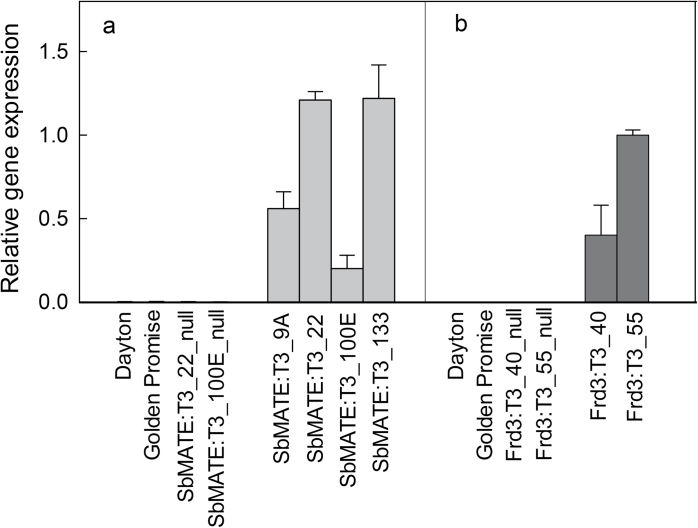
Fig. 1.
Relative expression of SbMATE (A) and FRD3 (B) in transgenic and control barley lines. Quantitative reverse-transcription PCR was measured in T3 transgenic lines, null lines, and two wild-type control cultivars: Dayton (Al3+-resistant) and Golden Promise (Al3+-sensitive parental line). cDNA was prepared from root apices of barley lines and expression measured relative to the reference gene actin. Data are mean and standard error (n=3, biological replicates).

