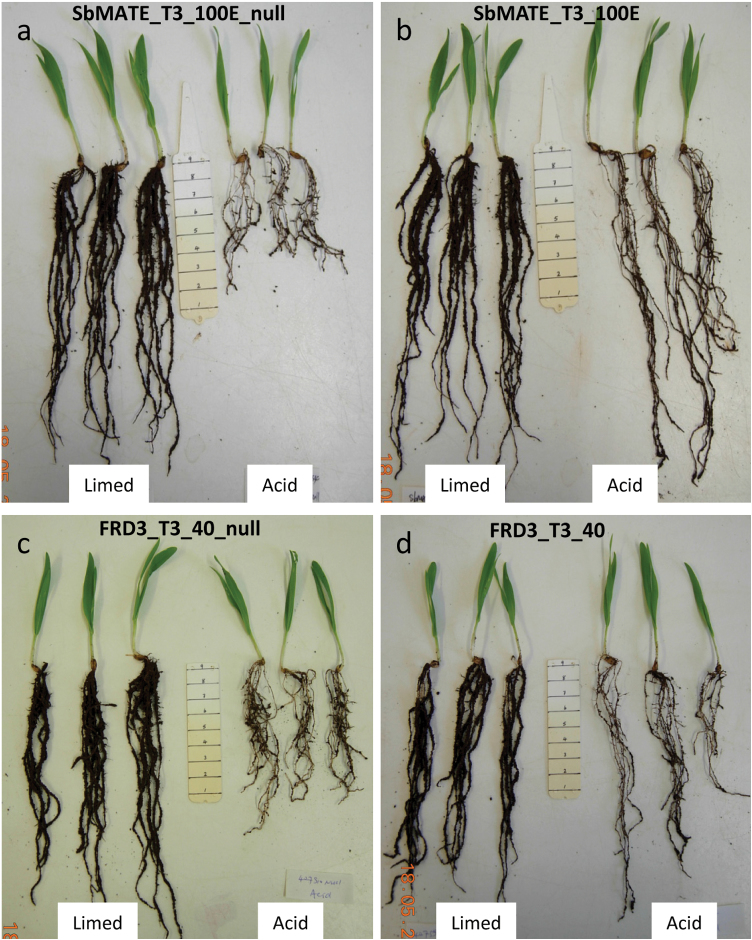
Fig. 4.
Barley plants at the end of the soil experiment. Representative plants of SbMATE:T3_100E_null (A), SbMATE:T3_100E (B), FRD3:T3_40_null (C), and FRD3:T3_40 (D) grown in limed and acid soil. Note that the roots on the transgenic plants and null plants are similar in the limed soil but longer on the transgenic plants than the null controls but in acid soil. Shoots do not show strong phenotypes between the acid and limed soils (this figure is available in colour at JXB online).

