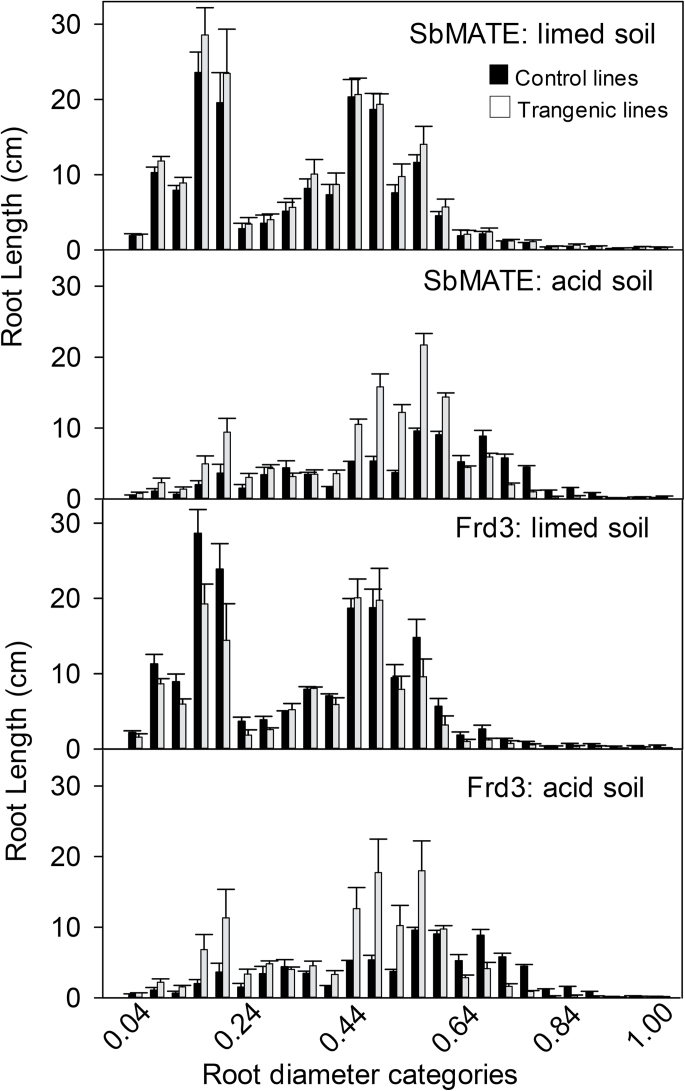
Fig. 6.
Distribution of root diameters on soil-grown plants. Transgenic plants expressing SbMATE or FRD3 and control plants were grown in a limed soil or acid soil for 6 d. The roots were washed and scanned with WinRHIZO and the total root length falling within each diameter class was estimated. Black indicates control lines not expressing a transgene and these include the two nulls and Golden Promise (mean and standard error, n=3); grey indicates transgenic lines expressing a transgene; data are mean and standard error for the SbMATE lines (n=4) and mean and range for FRD3 lines (n=2). The diameter categories increase in 40-μm increments from 0 to 1.0mm.

